
Why the Sludge Train Is Where F&V Plants Lose Money
Most vegetable processors focus engineering hours on the liquid side of the train — equalization, DAF, biological oxidation — and treat the solids stream as an afterthought. The numbers say otherwise. Across municipal and food-industry plants of comparable size, 60–80% of a wastewater facility's 20-year lifecycle OPEX sits in solids handling, thickening, dewatering, and disposal, not in BOD/COD removal. Vegetable processing makes that ratio worse, because the wastewater carries high solid loads, coarse debris (peels, trimmings, pulp), and significant grit from washing operations (HUBER, 2024; Water Tecnik, 2024). Skimping on sludge sizing shows up quickly as haul-off tonnage, polymer spend, and lagoon accumulation.
A concrete field signal: in the Park/UNBC 2012 study of full-scale anaerobic co-digestion with fruit and vegetable waste (FVW), undigested FVW was visible in the dewatered cake when the waste was fed to the second-stage digester — a classic short-circuiting symptom that means the upstream thickening and HRT were under-sized for the solids load (UNBC, 2012). That is the same failure mode that drives up hauling cost in plants that never install digestion at all.
Three end-of-pipe routes are viable for F&V biosolids: (a) direct disposal to landfill or lagoon, (b) land application as a soil amendment, and (c) anaerobic co-digestion with energy recovery. The rest of this article sizes the unit operations in front of each route and gives a 2026 decision rule for picking between them.
Solids Characteristics From Washing to Biological Treatment
Vegetable processing wastewater is notoriously variable. EPA 1977 (625/3-77-077) flags daily and seasonal shutdown/startup as the single biggest driver of load swings, and that variability is passed straight to the sludge train as instantaneous mass-loading shocks (EPA, 1977-07). Design for the 90th-percentile day, not the seasonal average.
Primary sludge from F&V streams is typically 0.5–3% dry solids (DS), with a high organic fraction and a floatables load — oils, peel fragments, starches — that defeats conventional primary clarification. HUBER's process notes for fruit and vegetable lines recommend DAF over gravity settling precisely because micro-bubbles lift colloidal organics and floatables that would otherwise escape a primary tank (HUBER, 2024). The grit fraction is also high; sand and soil from washing operations need a dedicated removal step (ROTAMAT® Ro6 or equivalent) before the sludge train, otherwise it shortens dewatering equipment life.
Where a biological stage is used (aerated lagoon or activated sludge), waste activated sludge (WAS) typically runs 0.5–1.2% DS and has poor dewaterability without polymer conditioning. EPA 1977 Tables V-1 and V-2 give the baseline: F&V primary sludge is roughly 65–80% volatile, while WAS from a fruit/vegetable-fed activated-sludge plant trends higher in volatiles and binds more water per gram of solids (EPA, 1977-07). For a 1 mgd plant operating 90 days/season, EPA's hypothetical case produces on the order of 700 lb/day of screenings plus primary and secondary solids — enough that a single haul truck per week becomes the operational baseline.
Seasonality is not a footnote. The same EPA document notes that a plant processing sauerkraut, snap beans, or tomatoes generates biosolids only during the campaign, which means storage and rapid dewatering beat steady-state digestion in most cost models.
Thickening Options: DAF, Gravity, and Centrifuge Compared
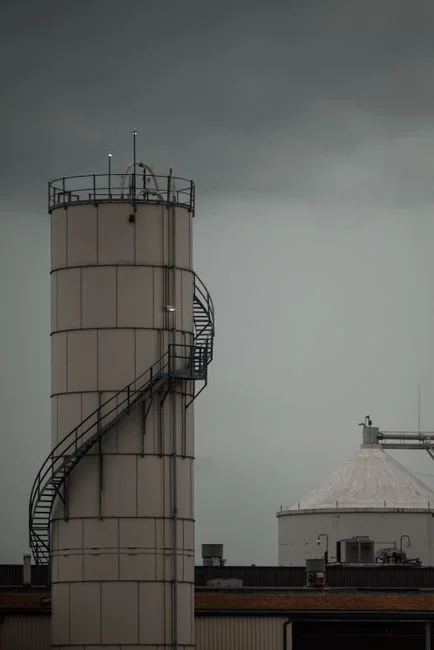
Thickening is the cheapest place in the train to cut downstream dewatering and hauling cost. Three technologies dominate F&V applications, and the right pick depends on solids composition, footprint, and how much polymer you're willing to dose.
DAF thickening delivers 3–6% DS underflow at hydraulic loadings of roughly 10–25 m/h, captures colloidal organics and floatables via 20–80 µm micro-bubbles, and tolerates the high oil/grease load common in vegetable wash water. It is the default for F&V streams where floatables and colloids dominate. A typical F&V wash line plus secondary sludge stream falls in the 4–300 m³/h range, which the HydropureWater dissolved air flotation system covers across 13 models — useful when you're trying to standardize on one platform for multi-line plants.
Gravity thickening is the lowest-O&M option but only viable when WAS dominates and floatables are low. Expect 2–4% DS, a large footprint (typically 4–6 m² per m³/d of feed), and poor capture of fines. Most F&V plants skip it because the floatables load causes crusting and odor.
Centrifuge thickening pushes underflow to 5–8% DS — the highest of the three — but at the cost of polymer dose (5–15 g/kg DS) and power (~15–25 kWh/t DS). It pays back only above ~10 t DS/day, where the higher underflow DS meaningfully shrinks digester volume.
| Parameter | DAF thickener | Gravity thickener | Centrifuge thickener |
|---|---|---|---|
| Underflow DS | 3–6% | 2–4% | 5–8% |
| Hydraulic loading | 10–25 m/h | 1–2 m/h (flux) | N/A (batch feed) |
| Polymer demand | Low (often none) | None | 5–15 g/kg DS |
| Power | ~2–5 kWh/t DS | Minimal | 15–25 kWh/t DS |
| Footprint | Compact | Large | Compact |
| Best fit | F&V with floatables, <10 t DS/day | WAS-dominant streams, cheap land | >10 t DS/day, space-constrained |
Anaerobic Digestion With Fruit and Vegetable Waste
For plants above ~5 t DS/day with a host WWTP or co-digestion facility within hauling distance, anaerobic digestion converts a disposal liability into an energy asset. The defining data point: co-digesting FVW with first-stage primary sludge yields 514 ± 57 L CH₄ per kg VS added, versus 392 ± 16 L CH₄/kg VS for second-stage addition (UNBC, 2012). Feed FVW to the first digester, not the second — the same study observed undigested FVW in the dewatered cake when it was added downstream, a clear HRT-short-circuit signal.
Translate that methane yield into energy: at a combined-heat-and-power (CHP) conversion of ~10 kWh per m³ of methane, 514 L CH₄/kg VS corresponds to roughly 5.1 kWh of recoverable electricity and heat per kg VS added. For a 5 t DS/day plant at ~80% VS, the theoretical energy output is on the order of 20,000 kWh/day — enough to offset a meaningful share of plant aeration and DAF power. Real-world capture is 30–50% of theoretical once digester heat losses and parasitic loads are netted out.
Pre-treatment economics remain case-specific. The UNBC work showed that combined alkaline and ultrasonic pre-treatment of sludge raised soluble TS, VS, and COD but did not significantly improve 28-day cumulative biogas — only the initial rate (UNBC, 2012). Run a bench test on your substrate before committing capex to ultrasound or caustic dosing.
Typical F&V co-digestion design points: HRT 15–25 days in the first stage at 35–38 °C (mesophilic), with VS loading of 2–4 kg VS/m³·d. Above 4 kg VS/m³·d you risk souring from rapid acidification of the FVW fraction.
Dewatering Technologies: Filter Press, Screw Press, Centrifuge
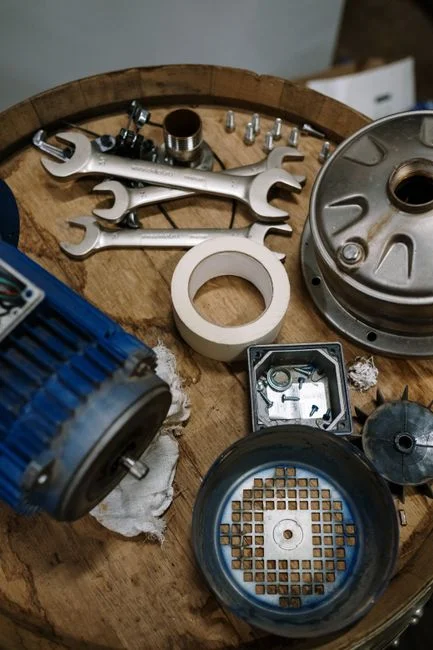
Dewatering is where the sludge train pays back — or doesn't. Cake dryness drives every hauling dollar downstream, and the gap between a 22% DS cake and a 30% DS cake is roughly $15–$40/wet ton in 2026 disposal cost, depending on region.
Plate-and-frame filter press delivers the driest cake of any mechanical option — 22–35% DS, with 60–80% moisture reduction across the press — at the cost of batch operation and higher capex. Modern presses span 1–500 m² of filtration area, and the plate and frame filter press is the right pick when haul-off volume reduction is the priority and labor can handle batch cycles. For a deeper sizing walkthrough, the 1000 m³/day filter press design guide covers the engineering steps.
Screw press runs continuous, hits 22–28% DS cake, and wins on capex and power (~1–3 kWh/t DS) below ~2 t DS/day. It is sensitive to upstream polymer conditioning and grind size — a 6 mm macerator ahead of the press is standard. HydropureWater field data and the published screw press OPEX benchmarks show annual maintenance spend clustering around 3–5% of capex once spare-parts lifecycle is amortized.
Decanter centrifuge produces 20–30% DS cake and is the workhorse for plants above 5 t DS/day. Polymer demand is 8–20 g/kg DS, and the technology baseline traces back to EPA 1977 Table V-4 design criteria for solid-bowl centrifuges on F&V sludge — the original V-2 sizing figure is still cited in current vendor cut-sheets (EPA, 1977-07).
| Parameter | Plate-and-frame filter press | Screw press | Decanter centrifuge |
|---|---|---|---|
| Cake DS | 22–35% | 22–28% | 20–30% |
| Operation | Batch | Continuous | Continuous |
| Polymer dose | 1–5 g/kg DS | 2–8 g/kg DS | 8–20 g/kg DS |
| Power | 5–10 kWh/t DS | 1–3 kWh/t DS | 10–20 kWh/t DS |
| Capex (relative) | High | Low | Medium-high |
| Best fit | Haul-off cost reduction, >2 t DS/day | <2 t DS/day, low capex | >5 t DS/day, proven track record |
Cost, Compliance, and Decision Framework for 2026
EPA 1977 anchored hauling at ~$4/cy and ~$80/ton, and screening disposal ran roughly 0.5¢/1000 gal amortized (EPA, 1977-07). Inflation has moved the dial sharply: in 2026, F&V biosolids hauling typically lands in the $40–$120/wet ton range depending on distance, cake solids, and gate fees (HydropureWater field data, 2026). The dewatering target for economic haul-off is therefore ≥22% DS — below that, you're paying to transport water.
Compliance still drives the floor. EPA 1977 Table 1-4 sets federal effluent limits in lb of BOD/TSS per ton of raw product — for example, 3.02/5.34 (1977 daily max BOD/TSS) for sauerkraut cutting, scaling down to 1.80/3.28 for snap beans (EPA, 1977-07). Meeting those limits still generates sludge; it does not eliminate it. Plan the train accordingly.
Use this decision rule for 2026:
- >5 t DS/day + co-digestion host within 30 km: DAF thickener → mesophilic anaerobic digester → plate-and-frame filter press. Add a CHP unit if gas yield justifies it.
- 1–5 t DS/day: DAF thickener → screw press or small plate press. Skip digestion; dewater and haul.
- <1 t DS/day: DAF thickening only → roll-off hauling with no mechanical dewatering. Re-evaluate if seasonal production crosses the 1 t DS/day threshold.
| Plant size | Thickener | Digestion | Dewatering | OPEX driver to watch |
|---|---|---|---|---|
| >5 t DS/day + host | DAF or centrifuge | Yes (1st-stage, 15–25 d HRT) | Plate-and-frame filter press | CHP utilization, polymer |
| 1–5 t DS/day | DAF | No | Screw press or small plate press | Haul-off $/ton, wear parts |
| <1 t DS/day | DAF | No | None / roll-off | Roll-off frequency, gate fees |
Whatever the path, optimize dewatering and disposal cost alongside energy recovery. The two are linked — every percentage point of additional cake DS cuts hauling mass and increases digester feed concentration, and vice versa.
Frequently Asked Questions
What cake dryness should I target for haul-off cost efficiency?
Aim for ≥22% DS (≤78% moisture). Below that, hauling cost is dominated by water mass. Plate-and-frame filter presses routinely deliver 22–35% DS, screw presses 22–28% DS, and decanter centrifuges 20–30% DS.
Is F&V sludge suitable for land application?
Yes, with limits. F&V biosolids are typically low in heavy metals and pathogens, and federal/state Part 503-style frameworks (and EPA 1977 Table IV-4 recommended maximum limits for inorganic constituents in irrigation water) apply. Confirm local pathogen and metal limits before applying to food crops.
Why is DAF preferred over primary clarification for F&V streams?
DAF lifts colloidal organics, oils, and floatables (peels, starches) that escape a settling tank. EPA 1977 and current HUBER process notes both flag DAF as the default primary step for fruit and vegetable wash water for that reason.
What HRT is needed for fruit-and-vegetable waste co-digestion?
Feed FVW to the first-stage mesophilic digester at 35–38 °C with an HRT of 15–25 days and a VS loading of 2–4 kg VS/m³·d. The UNBC 2012 study showed first-stage addition yielded 514 L CH₄/kg VS added versus 392 L for second-stage.
Does sludge pre-treatment (alkaline, ultrasonic) pay back?
Case-specific. The UNBC 2012 work found that combined alkaline + ultrasonic pre-treatment raised soluble TS, VS, and COD and increased the initial methane rate, but did not significantly improve 28-day cumulative biogas. Run a bench test on your substrate before sizing capex.