Why Pleasanton Chemicals Plants Are Re-evaluating CAS vs MBR in 2026
For Chemicals & Allied Products (NAICS 325 / Industrial Organic Chemicals) wastewater in Pleasanton, MBRs typically deliver 60% smaller footprint, higher MLSS (8–12 g/L vs 2–4 g/L), and longer SRT than conventional activated sludge, while CAS remains cheaper at high flow with stable loads. Choose MBR when effluent must meet SF Bay RWQCB/POTW limits under variable influent or space constraints; choose CAS when cost dominates and load is steady.
Two forces are pushing the 2026 re-evaluation. First, the San Francisco Bay Regional Water Quality Control Board's Basin Plan and the City of Pleasanton Water Reclamation Plant pretreatment envelope (administered through the Bay Area Clean Water Agencies discharge framework) continue to tighten expectations for trace organics, salinity, and nutrients on industrial users discharging to the sanitary sewer. Second, the influent itself is getting harder to settle: NAICS 325 streams typically run 1,500–8,000 mg/L COD, pH swings of 2–11 between batches, intermittent solvent slug loads, and total dissolved solids of 2,000–10,000 mg/L from acid/caustic cleaning cycles. Under those conditions, a secondary clarifier that worked in 2015 routinely fails in 2026.
The 2026 trend is clear: PFAS scrutiny, salinity ceilings, and trace-organic monitoring have moved MBR effluent quality from a nice-to-have to a permit-defensible position. A growing share of Pleasanton-area chemicals plants are using a 2026 upgrade memo to retire the existing CAS train and replace it with a compact submerged membrane bioreactor that doubles as the disinfection barrier. For context on the upstream pre-treatment side of the same decision, see the chemicals-wastewater DAF vs clarifier buyer's guide.
How Conventional Activated Sludge Treats Organic-Chemicals Wastewater
Conventional activated sludge (CAS) couples an aeration tank with a secondary clarifier, settling biomass out of the treated stream under gravity. Standard design windows for industrial organics lines are MLSS 2–4 g/L, SRT 5–15 d, and HRT 6–24 h, with F/M ratios of 0.2–0.5 kg BOD/kg MLSS·d (per standard wastewater engineering texts and confirmed in the JCHR 2026 comparative review).
CAS is the workhorse for good reason. It is the lowest-CAPEX biological option, the operating crew already knows it, and it absorbs a steady organic load of 0.4–1.0 kg COD/m³·d with predictable sludge production at a yield coefficient of 0.3–0.6 kg VSS/kg COD removed. The JCHR 2026 review explicitly frames CAS as the "large-scale, cost-sensitive" choice for plants where footprint is not binding and influent quality is steady.
Its weaknesses are well documented and acutely visible on organic-chemicals lines. The clarifier is sensitive to bulking sludge, which is common when filaments bloom under low F/M or high FOG conditions. Effluent TSS routinely drifts to 20–50 mg/L, oils and free-floating solvents pass through, and refractory organics such as phenols, glycols, and aromatic solvents only partially biodegrade at short SRT. A 2026-era chemicals plant running batch reactors cannot easily buffer all of that variability in a clarifier.
How MBR Treats the Same Wastewater Differently
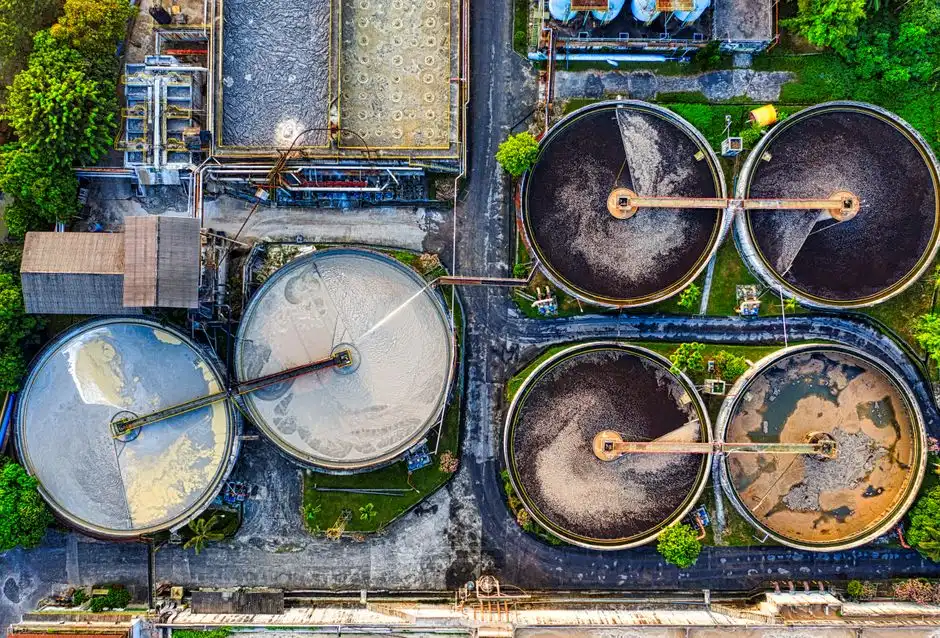
A membrane bioreactor (MBR) replaces the secondary clarifier with submerged PVDF ultrafiltration membranes, typically 0.1–0.2 μm nominal pore size, immersed directly in the aeration basin. Mixed liquor is held at MLSS 8–12 g/L with SRT 20–60 d and HRT 4–8 h, per the Springer 2025 fouling-control review and HydropureWater MBR catalog specs.
Three operational consequences follow. First, no clarifier means roughly 60% less floor area than an equivalent CAS train — a 500 m³/d unit that needs ~180 m² in CAS typically fits in ~70 m² as a submerged PVDF MBR system, with no separate sludge-settling zone to maintain. Second, longer SRT enriches slow-growing nitrifiers and degrades more of the refractory organics (phenols, glycol ethers, nitriles) that pass through CAS. Third, the membrane's physical barrier delivers consistent effluent quality regardless of sludge settleability, and produces a near-disinfected stream that often satisfies the secondary disinfection requirement in one step.
Trade-offs are real. Membrane fouling from extracellular polymeric substances (EPS) and soluble microbial products (SMP) is the central MBR objection, and aeration energy rises 10–25% versus CAS because of the crossflow scour. Periodic clean-in-place (CIP) with NaOCl and citric acid — typically every 3–6 months — and membrane replacement at year 7–10 are recurring OPEX items. For a full submerged PVDF MBR system spec on a 50–500 m³/d chemicals line, the DF-series architecture is a common reference point.
Side-by-Side Parameter Comparison for Industrial Organic Chemicals
The table below is calibrated for a NAICS 325 influent of 1,500–8,000 mg/L COD, 200–600 mg/L BOD₅, variable pH, and 2,000–10,000 mg/L TDS — not a municipal or pulp-and-paper envelope. MBR numbers reflect Springer 2025 review data; CAS numbers reflect industry-typical design windows for industrial organic-chemicals service.
| Parameter | CAS (Conventional Activated Sludge) | MBR (Submerged PVDF) | Best Fit |
|---|---|---|---|
| MLSS (mixed liquor suspended solids) | 2–4 g/L | 8–12 g/L | MBR for compact bioreactor; CAS when settling is reliable |
| SRT (solids retention time) | 5–15 d | 20–60 d | MBR for nitrification + refractory organics |
| HRT (hydraulic retention time) | 6–24 h | 4–8 h | MBR for small equalization volume |
| Effluent COD | 60–150 mg/L | 20–40 mg/L (MGAC-AnFMBR 20 ± 3.9 mg/L at 4 h HRT, per Springer 2025) | MBR for tight SF Bay RWQCB envelope |
| Effluent TSS | 20–50 mg/L | <1–5 mg/L (membrane barrier) | MBR for near-reuse polishing |
| Footprint (relative) | 1.0× baseline | ~0.4× (~60% reduction) | MBR for footprint-constrained retrofits |
| Sludge yield (Y) | 0.3–0.6 kg VSS/kg COD | 0.2–0.4 kg VSS/kg COD (lower at long SRT) | MBR for reduced hauling cost |
| Shock-load tolerance | Moderate; clarifier upset risk | High; barrier independent of settling | MBR for batch / variable influent |
| CAPEX index (relative) | 0.7–0.8× | 1.0–1.2× | CAS when CAPEX is the binding constraint |
| OPEX index (relative) | 0.8–0.9× | 1.1–1.25× (aeration + CIP + membrane) | CAS for steady high flow |
| Fouling risk | Low (no membranes) | Moderate; managed by flux, aeration, CIP | Tie — depends on influent character |
For engineers sizing a retrofit, the headline contrasts are MLSS 8–12 g/L vs 2–4 g/L (driving smaller tanks), SRT 20–60 d vs 5–15 d (driving better nitrification and refractory removal), and footprint roughly 40% of an equivalent CAS train. A replaceable PVDF flat-sheet MBR cassette architecture such as the DF-series module is typically the format that lets a plant stage replacement without draining the basin.
Pleasanton-Specific Retrofit and OPEX Considerations
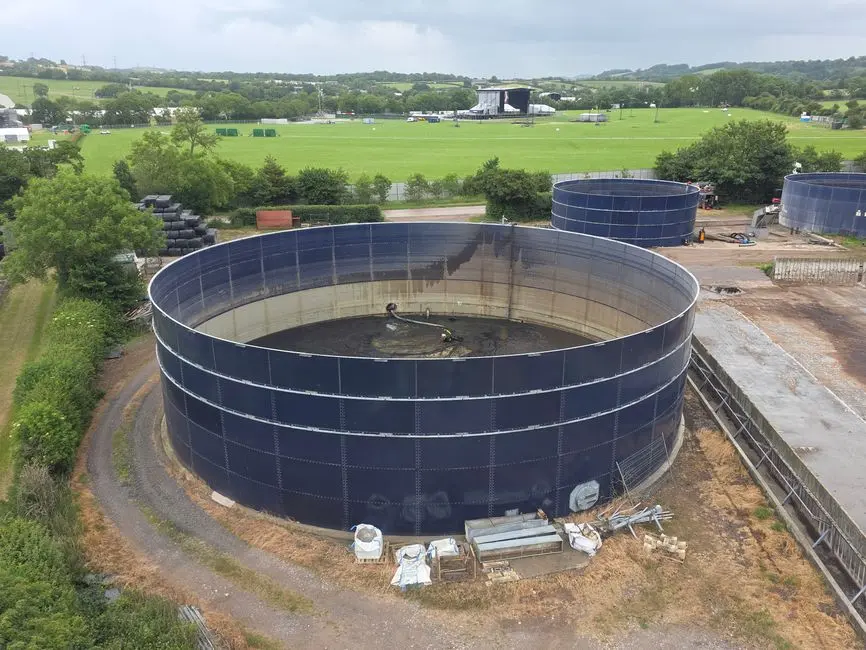
OPEX bands in 2026: CAS typically runs lower $/m³ at steady high flow because its energy is dominated by aeration and sludge hauling, while MBR carries a 10–25% OPEX premium from membrane aeration, CIP chemicals (NaOCl ~0.3–0.5% w/w, citric acid ~1–2%), and membrane replacement amortized over a 7–10 year life. For a 250 m³/d Pleasanton chemicals plant, that translates to a per-cubic-metre delta of roughly $0.10–0.30/m³ depending on influent fouling potential — material, but usually recoverable through reduced sludge hauling and the elimination of tertiary polishing.
The retrofit angle matters more than the OPEX delta. Most Pleasanton chemical plants built in the 1980s–2000s have headroom in their process tanks but no expansion floor space. A 60% footprint reduction is often the difference between "feasible upgrade" and "build a new shed." Cold weather is a minor risk: Springer 2025 cites a 75% permeability drop below 10 °C (Gurung 2017), but Pleasanton's mean winter low is 5–8 °C and outdoor tanks are usually insulated or buried, so this is a design note rather than a deal-breaker.
Final discharge to the City of Pleasanton Water Reclamation Plant may still need upstream equalization, a DAF pre-treatment skid for oil and FOG, and chemical dose trim for pH or phosphorus. For plants debating DAF vs clarifier upstream of the biological step, the DAF vs clarifier buyer's guide for related industrial service covers the same engineering logic.
Fouling Control and 2026 Upgrade Options
The honest objection to MBR is membrane fouling. The Springer 2025 review documents four 2025-era mitigations that move fouling from a "show-stopper" concern to a managed cost line.
First, aerobic granular sludge MBR (AGS-MBR) ran 61 days at a high flux of 20 L/m²·h with low fouling, compared to flocculent and bulking sludge MBRs that fouled far faster (Springer 2025). Granular sludge's larger, denser flocs scour the membrane surface more effectively and release less fine SMP. Second, an applied electric field of 0.5 V suppressed fouling rate by ~23% and cut organic foulants on the membrane by ~10% over long-term operation (Springer 2025). Third, the E-AnMBR variant cut sludge yield by 41.2% and SVI by 32.5%, easing the membrane's solid and EPS load. Fourth, the MGAC-AnFMBR with fluidized granular activated carbon ran 192 days at 6–11 L/m²·h with TMP ≤ 0.1 bar and no fouling control beyond GAC scouring — a useful benchmark for plants considering PAC dosing anyway.
The practical implication: a chemicals plant specifying an MBR in 2026 should plan for flux ≤15 L/m²·h, intermittent relaxation/backflush cycles, and a CIP interval of 3–6 months. Staging a replaceable PVDF flat-sheet MBR cassette inventory lets a plant swap elements in hours rather than waiting on a membrane lead time of 4–8 weeks.
Decision Framework: When to Choose MBR vs CAS in Pleasanton
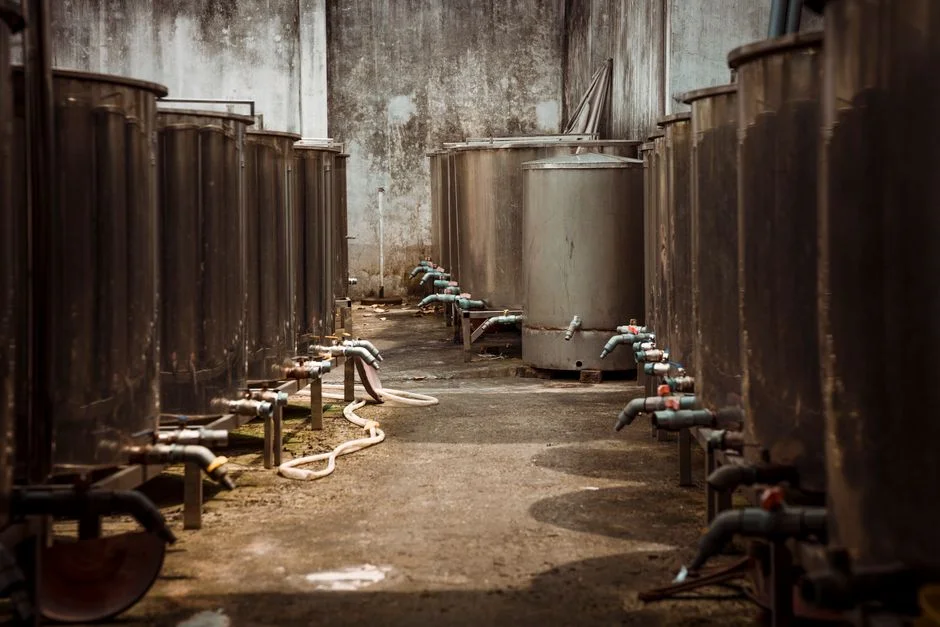
Three questions resolve most upgrade memos in a single meeting.
Q1 — Is variable organic load or upset recovery a priority, or is footprint the binding constraint? If yes to either, MBR wins. The 8–12 g/L MLSS and membrane barrier absorb batch swings that would push a clarifier into bulking, and the ~60% footprint saving is decisive on most Pleasanton sites.
Q2 — Is steady-state high flow the dominant case, with CAPEX as the binding constraint? If yes, CAS wins. At 5+ kg COD/m³·d with a 24-hour equalized feed, CAS delivers 60–150 mg/L effluent COD at the lowest installed cost.
Q3 — Is water reuse or recycle on the 5-year roadmap? If yes, MBR wins. Effluent at <5 mg/L TSS and 20–40 mg/L COD is one RO pass away from cooling-tower make-up or boiler feed.
For plants stuck between the two, a hybrid A/O-MBR or A²/O-MBR delivers 84% TP removal (per Yang 2010, cited in Springer 2025) at moderate cost and is a defensible compromise when nutrients — not just organics — are on the permit radar.
Frequently Asked Questions
Does MBR cut enough footprint to justify the OPEX premium for a Pleasanton chemicals plant?
For most retrofit sites, yes. A 60% footprint reduction versus CAS often converts an infeasible upgrade into a feasible one, and the 10–25% OPEX premium is typically recovered within 3–5 years through lower sludge hauling, eliminated tertiary clarifier maintenance, and the membrane's disinfection-barrier credit. The decision pivots on whether floor space is binding.
Can MBR handle the COD swings from batch organic-chemicals reactors?
Yes, and it handles them more reliably than CAS. Submerged PVDF MBRs at MLSS 8–12 g/L and SRT 20–60 d absorb 2–3× influent COD swings without effluent breakthrough, because the physical membrane barrier is independent of sludge settleability. Springer 2025 documents AnMBR stable operation at organic loading rates of 1.1–7.9 kg COD/m³·d on confectionery wastewater, a comparable high-strength, variable feed.
What effluent COD and TSS can MBR realistically hit for SF Bay RWQCB discharge?
On chemicals influent, an MBR with PVDF ultrafiltration consistently delivers 20–40 mg/L effluent COD and <1–5 mg/L TSS. Springer 2025 reports MGAC-AnFMBR at 20 ± 3.9 mg/L COD at a 4 h HRT and AnFMBR at 28 ± 5.2 mg/L. Those numbers are comfortably below typical SF Bay RWQCB/POTW industrial pretreatment envelopes and leave headroom for the receiving plant's own discharge limits.
How often must MBR membranes be cleaned or replaced on a chemicals line?
Plan for routine CIP every 3–6 months using NaOCl (200–500 mg/L free chlorine) followed by citric acid (1–2% w/w), with a recovery clean if TMP rises faster than the baseline trend. Membrane element life on PVDF flat-sheet modules in industrial service is typically 7–10 years, with replacement being a cassette swap rather than a tank retrofit. Staging a spare set of replaceable PVDF flat-sheet MBR cassette elements eliminates 4–8 week lead-time exposure.
Is CAS still defensible for a new organic-chemicals plant in 2026, or is MBR the new default?
CAS remains defensible for greenfield sites with abundant land, a single-product steady-state feed, and a CAPEX ceiling that MBR cannot meet. For most 2026 chemicals projects in the Pleasanton area — variable batch loads, tight effluent envelopes, footprint-constrained sites, and a 5-year reuse roadmap — MBR is the new default. The Springer 2025 fouling-control mitigations and the JCHR 2026 comparative review both point in that direction.