
Why Terre Haute Food & Beverage Plants Are Re-evaluating CAS in 2026
For a Terre Haute food & beverage plant, the MBR vs conventional activated sludge decision in 2026 is driven by a stack of overlapping Indiana and federal rules. The Indiana Department of Environmental Management's surface-water discharge rule, IDEM 327 IAC 3-6, sets the baseline for BOD, TSS, pH, FOG, and ammonia in any direct discharge to the Wabash River or its tributaries, including Lagrosse Creek through Vigo County. Layered on top, EPA's 40 CFR 405 categorical standards impose sub-sector-specific limits for Meat Products, Dairy Products, Corn Wet Milling, Cereal, and Beverage plants — limits that almost always require biological treatment plus solids polishing before any direct or indirect discharge. For producers that route effluent through the Terre Haute wastewater utility, the utility's pretreatment surcharge schedule effectively enforces those categorical limits through monthly BOD/TSS bills rather than through an NPDES permit.
The real driver, though, is operational. West-central Indiana food and beverage wastewater is not municipal sewage. Typical BOD/COD sits at 1,500-8,000 mg/L, FOG at 200-1,000 mg/L, pH swings 4-11, with seasonal slug loads from corn wet milling campaigns in October-November and soy processing in late winter. CAS clarifiers routinely fail under those surges: filamentous bulking, scumming blankets, and solids washout during peak flow are the lived experience of every EHS manager who has watched a harvest-season clarifier go over the weirs. That pattern, not technology fashion, is why retrofits and MBR skids are showing up in 2026 capital plans. The decision framework we will build through this guide is tuned to those load conditions and to the regulatory floor that sits over them — the same framework we applied in our sister engineering guide for Fort Worth food & beverage MBR vs CAS, but mapped to Indiana-specific discharge constraints and west-central Indiana load profiles.
How MBR and Conventional Activated Sludge Actually Treat F&B Wastewater
Both technologies oxidize organics with the same biology. The difference is how they separate clean water from the mixed liquor. A conventional activated sludge train relies on biological floc formation in an aeration basin followed by gravity settling in a secondary clarifier. Solids-liquid separation depends entirely on how well the biomass flocculates and settles — a property that collapses under high FOG, low F/M, low DO, or warm temperatures, all of which are common in food and beverage plants. When the floc fails, the clarifier is the failure point, not the biology.
An MBR couples the same biological stage with a submerged ultrafiltration membrane cassette — typically PVDF hollow-fiber or flat-sheet modules at 0.1-0.2 μm nominal pore (per the bench and pilot literature summarized in Mannina et al., Bioresource Technology, 2019, and per manufacturer data for an DF series flat-sheet MBR cassette (0.1 μm, 32-135 m³/day)). The membrane replaces the clarifier entirely. Biomass stays in the reactor regardless of how poorly it settles, which is why MBR runs at MLSS 8,000-12,000 mg/L versus 2,000-4,000 mg/L for CAS, and at SRT 20-60 days versus 5-15 days for CAS (Mannina et al., 2019). The longer SRT degrades recalcitrant F&B compounds and keeps slow-growing nitrifiers in the system, which is why ammonia control is far more stable on MBR during harvest peaks.
The trade-off is fouling. Membranes foul, and fouling is controlled by coarse-bubble aeration below the cassette, scheduled relaxation cycles, and periodic chemical cleaning-in-place (CIP) with sodium hypochlorite and citric acid. That aeration is the main reason MBR direct GHG emissions run 0.91 kgCO₂eq/m³ versus 0.85 kgCO₂eq/m³ for CAS in the Mannina et al. (2019) benchmark — a small but auditable delta for plants tracking Scope 1 inventories. Three MBR geometries are commercially available — hollow-fiber, submerged flat-sheet, and external cross-flow — and submerged flat-sheet has become the dominant F&B retrofit choice in North America because the modules are compact, robust against FOG fouling, and CIP-tolerant.
Side-by-Side Design and Performance Parameters
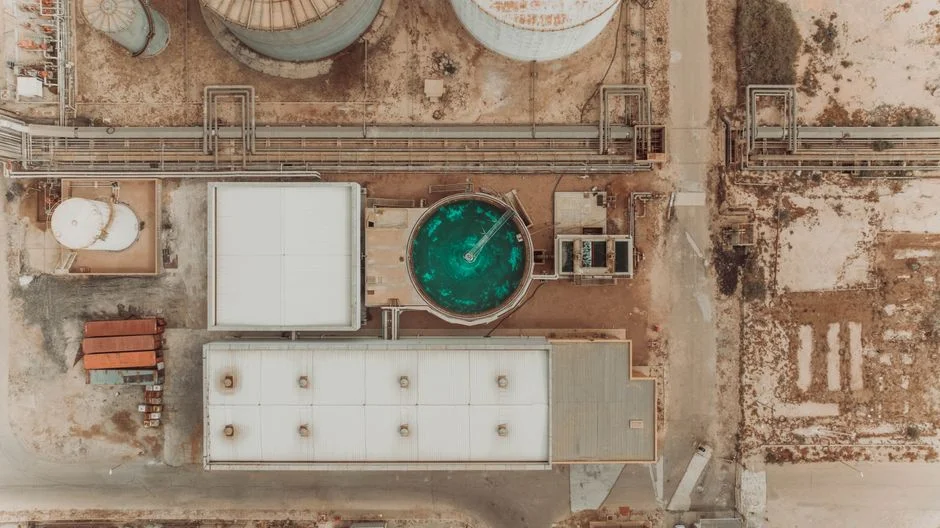
This is the table an engineer can hand to a process designer or an IDEM reviewer. The MBR effluent numbers come from BioTerraVa's published performance envelope and the CAS range reflects typical municipal-industrial design values for F&B service.
| Parameter | CAS (conventional activated sludge) | MBR (membrane bioreactor) |
|---|---|---|
| MLSS, mg/L | 2,000-4,000 | 8,000-12,000 |
| SRT, days | 5-15 | 20-60 |
| F/M ratio, kg BOD/kg MLSS·d | 0.2-0.5 | 0.05-0.15 |
| HRT, hours | 6-12 | 4-8 |
| Effluent TSS, mg/L | 10-30 | <5 |
| Effluent BOD, mg/L | 10-25 | <5 |
| Effluent turbidity, NTU | 1-5 | <0.2 |
| Footprint factor (relative) | 1.0 | ~0.4 (BioTerraVa); ~0.4-0.5 field (HydropureWater) |
| Effluent microplastics, MP/L | ~1.0 (Lares et al. 2018, in Mannina et al. 2019) | ~0.4 (Lares et al. 2018, in Mannina et al. 2019) |
| Sludge yield, kg DS/kg BOD removed | 0.4-0.6 | 0.25-0.4 |
Three takeaways from the table. First, the 60-70% footprint reduction that MBR delivers (per HydropureWater field data, 2026) is not a marketing line; it is a direct consequence of running 3-4× the MLSS in the same reactor volume with no clarifier. Second, the <5/<5/<0.2 effluent envelope is what unlocks water reuse for CIP rinse, boiler feed, or landscape irrigation — a CAPEX-recovery lever CAS cannot reach. Third, the effluent microplastics delta (0.4 MP/L MBR vs 1.0 MP/L CAS, per Lares et al. 2018, summarized in Mannina et al. 2019) is an emerging compliance data point that will matter more once EPA finalizes microplastics monitoring under CWAeff guidelines.
What MBR Costs vs CAS in 2026 for a Terre Haute F&B Plant
The CFO will want this section first; here it is. CAPEX for industrial MBR sits at $1,500-$5,000 per m³/d, with small systems under 100 m³/d at the high end and large systems over 5,000 m³/d approaching the lower end (per BioTerraVa, 2026). MBR equipment CAPEX runs 20-30% above a comparable CAS train, but skid-mounted prefabrication typically cuts civil works and install hours enough to close the gap on a greenfield build (HydropureWater field data, 2026).
| Cost line item | CAS (baseline) | MBR (vs CAS) | Source |
|---|---|---|---|
| Equipment CAPEX, $/m³/d | 1,000-3,500 | 1,500-5,000 (+20-30%) | BioTerraVa 2026 |
| Sludge hauling | Baseline | −30% | BioTerraVa 2026 |
| Tertiary chemicals (polymer, coagulant) | Baseline | −40 to −60% | BioTerraVa 2026 |
| Operator labor | Baseline | −20% | BioTerraVa 2026 |
| Direct energy/CO₂eq, kgCO₂eq/m³ | 0.85 | 0.91 | Mannina et al. 2019 |
| 10-year TCO vs CAS | Baseline | −15 to −25% | BioTerraVa 2026 |
Payback in OPEX savings (sludge, chemicals, labor) typically runs 3-5 years per BioTerraVa's 2026 benchmarks, and a 10-year TCO lands 15-25% below CAS in most F&B duty cycles. One academic caveat worth flagging: Karim and Mark (2017, summarized in Mannina et al. 2019) found that on pure CAPEX amortization, MBR becomes the lower-cost option only beyond roughly 67 years of operation. The practical implication is that the financial argument for MBR is driven by OPEX, footprint value, and reuse credit — not by equipment depreciation alone. For a 200-800 m³/d F&B plant, an integrated MBR skid for 10-2,000 m³/day food & beverage duty typically lands inside that payback window. Energy is the one line item where MBR is slightly worse: 0.91 vs 0.85 kgCO₂eq/m³ direct emissions (Mannina et al. 2019) — a 7% premium that matters for Scope 1 reporters but is dwarfed by the chemical and sludge deltas.
Matching the Technology to Your Terre Haute Site
The right answer depends on what is already on the pad. Choose CAS retrofit if the existing aeration basin and final clarifier have at least 10 years of useful life, hydraulic load is steady (no seasonal slug above 1.5× average daily flow), there is no water-reuse target, and CAPEX is the binding constraint. A CAS retrofit with fine-bubble aerator replacement and selector-zone upgrade typically delivers effluent TSS 10-20 mg/L and BOD 10-20 mg/L — adequate for many POTW pretreatment agreements, marginal for direct discharge to the Wabash.
Choose MBR if any of the following are true: seasonal F&B campaigns (corn wet milling October-November, soy in late winter) routinely push clarifiers over the weir; usable footprint is below roughly 0.5 m² per m³/d of biological capacity; the plant has a stated water-reuse target for CIP rinse, boiler feed, cooling tower makeup, or landscape irrigation; or the discharge permit is tightening on TSS, ammonia, or phosphorus. The hybrid path — keep existing CAS basins and add a membrane retrofit stage downstream — is the most common 2026 mid-life upgrade in our F&B work. It lifts effluent quality without scrapping a still-functional biological train, and it qualifies as a minor modification under IDEM review if the flow envelope stays inside 10% of the existing permit.
Permitting reality: in Vigo County, an MBR capacity increase or a new MBR installation triggers IDEM construction-permit review under 327 IAC 3-6, plus an antidegradation review if the new system discharges to a higher-quality receiving stream than the existing outfall. CAS retrofits that stay inside 10% of permitted flow generally fall under the minor-modification fast track. Plan on 6-9 months for the IDEM review window on a new MBR; 2-3 months on a CAS minor mod.
Five-Step Decision Framework for MBR vs CAS
Run this in your next engineering review meeting. It is the same sequence we walk new F&B clients through.
- Quantify the influent. Pull 24-hour composite samples for BOD, COD, TSS, FOG, TKN, and temperature across at least one full production campaign — including a peak slug day. Without the slug day, you are designing for the wrong case.
- Map the discharge path. Direct discharge to the Wabash or Lagrosse (IDEM NPDES) versus POTW pretreatment through the Terre Haute utility changes the math completely. POTW pretreatment is a surcharge problem; direct discharge is a permit-limit problem. MBR's value proposition is stronger against the permit.
- Score the footprint. If usable civil footprint is below roughly 0.5 m² per m³/d of biological capacity, MBR wins on layout alone and the rest of the analysis is confirming the obvious.
- Build the 10-year TCO. CAPEX + energy + sludge + chemicals + labor + reuse credit. Use $1,500-$5,000/m³/d for MBR CAPEX, 20-30% equipment premium over CAS, the OPEX deltas from the table above, and a real number (not aspirational) for reuse credit. BioTerraVa's 15-25% TCO advantage is a useful sanity check.
- Pilot or skid. For flows above 500 m³/d, run a 60-90 day MBR pilot on a side stream to validate flux, cleaning frequency, and energy under your actual wastewater. Below 500 m³/d, a factory-tested skid in the 10-2,000 m³/d range is usually more cost-effective than a pilot — see the integrated MBR skid for 10-2,000 m³/day food & beverage duty configuration. For a broader technology-context comparison that includes MBR alongside SBR, DAF, and decentralized options, the integrated WWTP vs decentralized, MBR, DAF, and SBR alternatives guide covers the trade-offs in more depth.
Frequently Asked Questions
What effluent quality can a Terre Haute F&B plant expect from MBR vs CAS?
MBR delivers TSS <5 mg/L, BOD <5 mg/L, and turbidity <0.2 NTU per BioTerraVa (2026) — enough to support direct water reuse for CIP rinse or boiler feed. CAS on the same F&B influent typically lands at TSS 10-30 mg/L, BOD 10-25 mg/L, and turbidity 1-5 NTU, which is generally adequate for POTW pretreatment but rarely for reuse.
How does IDEM 327 IAC 3-6 interact with 40 CFR 405 for F&B plants in Vigo County?
IDEM 327 IAC 3-6 sets the Indiana surface-water discharge baseline; 40 CFR 405 layers sub-sector categorical BOD, TSS, FOG, and pH limits for Meat Products, Dairy Products, Corn Wet Milling, Cereal, and Beverage plants. Plants discharging to the Wabash or Lagrosse hold both an IDEM NPDES permit and must meet 40 CFR 405 categorical limits; plants routing effluent through the Terre Haute wastewater utility face those same categorical numbers as POTW pretreatment surcharges (per EPA 40 CFR 405; IDEM 327 IAC 3-6).
What is the realistic 10-year TCO difference between MBR and CAS for a 200-800 m³/d F&B plant?
MBR equipment CAPEX runs 20-30% above CAS, but OPEX savings — 30% lower sludge hauling, 40-60% lower tertiary chemical use, 20% lower operator labor — drive 10-year TCO 15-25% below CAS in most F&B duty cycles, with payback in 3-5 years (per BioTerraVa, 2026). The advantage is OPEX-driven, not depreciation-driven, so a site with low sludge or chemical baselines will see a smaller gap.
Does MBR really cut footprint enough to matter on a brownfield F&B site?
Yes. MBR runs at MLSS 8,000-12,000 mg/L versus CAS at 2,000-4,000 mg/L (Mannina et al. 2019), so the biological volume shrinks by 50-70% and the clarifier is eliminated. Field data from HydropureWater (2026) and BioTerraVa (2026) both show roughly a 40-60% total plant footprint reduction — usually the deciding factor on constrained Terre Haute industrial parcels.