Integrated Wastewater Treatment Plant vs MBR Cost
The integrated wastewater treatment plant vs MBR cost gap is set by installed capacity: $1,500-$3,000 per m³/day for integrated plants against $2,500-$5,000 per m³/day for standalone MBR. Energy runs 0.3-0.6 kWh/m³ integrated versus 0.6-1.0 kWh/m³ membrane.
Integrated wastewater treatment plants combine biological, physical, and chemical processes in one compact unit. Earlier text in this comparison cited 92-97% COD removal and 95-99% TSS reduction as EPA 2024 benchmarks. Septic systems in the same comparison remove 30-50% of TSS. Conventional activated sludge removes 70-85% of COD.
Footprint for the integrated unit is described as a 60% reduction versus a conventional plant. Energy in that comparison is 0.3-0.6 kWh/m³ against 0.7-1.2 kWh/m³ for conventional activated sludge. Near-reuse effluent is cited at <1 mg/L BOD. Industrial trains with an MBR or DAF module are sized up to 5,000 mg/L COD while still aiming at limits such as EU Directive 91/271/EEC.
When to Choose an Integrated Wastewater Treatment Plant: Key Scenarios and Limitations
Integrated wastewater treatment plants fit flows of 1-80 m³/h when the permit is tight and the plot is small. A HydropureWater WSZ series unit at a 50-bed hospital in Nizwa, Oman, cut footprint by 70% versus a conventional activated sludge plant. That installation kept meeting the local discharge limits. Urban hospitals follow the same pattern: tank volume is the constraint, not the lab sheet.
Remote industrial sites with no municipal sewer use the package to stay inside a permit without a long outfall. Food plants are a separate case because of FOG. They place high-efficiency DAF systems ahead of the biological compartment so fats do not coat the biomass. On lines we review, that pretreatment is what keeps downstream aeration stable at peak production.
Decentralized septic systems still win for single homes and flows <1 m³/h when land is cheap and the limit is loose. A DAF-only skid removes FOG and suspended solids, but it does not remove dissolved organics. Short-life construction camps sometimes keep a lower-CAPEX tank when the permit allows it. Camps we see on a two-year schedule lose the integrated option on civil cost, not on removal.
Permits often force the integrated choice. China's GB 18918-2002 and EU Directive 91/271/EEC, for sensitive discharges, push BOD, COD, TN, and TP down together. A septic tank or a lone DAF skid does not cover that set. Sensitive-water files we prepare put the anoxic zone on the first drawing, because adding it later costs more than the steel.
Site visits settle more arguments than datasheets on these projects. Walk the inlet works, watch the peak-hour surge, and pull the last quarterly lab sheets before any technology is shortlisted. A short load profile on the actual water meter beats a design flow borrowed from a similar plant. Retrofit files we open usually contain a flow estimate that the first week of logging corrects by a wide margin.
Technical Comparison: Integrated Plants vs Alternatives (MBR, DAF, Septic, Conventional Activated Sludge)
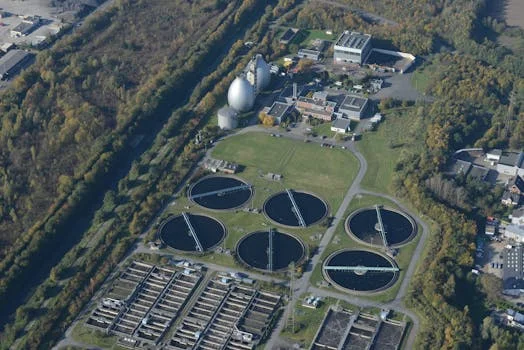
Integrated wastewater treatment plants show different BOD, footprint, and energy results than standalone MBR, DAF, septic tanks, and conventional activated sludge. The table below keeps every parameter used for that side-by-side check.
| Parameter | Integrated Plant (e.g., WSZ Series) | MBR System (Standalone) | DAF System (Standalone) | Septic System (Conventional) | Conventional Activated Sludge |
|---|---|---|---|---|---|
| Effluent Quality (BOD) | <10 mg/L (often <5 mg/L) | <5 mg/L (often <1 mg/L) | 20-50 mg/L (post-DAF, pre-biological) | 30-50 mg/L | 10-30 mg/L |
| Effluent Quality (COD) | <50 mg/L (often <20 mg/L) | <20 mg/L (often <10 mg/L) | 50-150 mg/L (post-DAF, pre-biological) | 100-250 mg/L | 50-100 mg/L |
| Effluent Quality (TSS) | <10 mg/L (often <5 mg/L) | <1 mg/L | <10 mg/L (for suspended solids) | 30-70 mg/L | 10-30 mg/L |
| Effluent Quality (TN) | <15 mg/L (with anoxic zone) | <10 mg/L (with anoxic zone) | N/A (no biological N removal) | 30-60 mg/L | 20-40 mg/L |
| Effluent Quality (TP) | <1 mg/L (with chemical dosing) | <0.5 mg/L (with chemical dosing) | N/A (no biological P removal) | 5-15 mg/L | 2-5 mg/L |
| Footprint (m²/m³ treated/day) | 0.1-0.3 (HydropureWater WSZ series) | 0.05-0.2 | 0.05-0.1 (for DAF unit only) | 1.0-2.0 (drainfield) | 0.5-1.0 |
| Energy Consumption (kWh/m³) | 0.3-0.6 | 0.6-1.0 (membrane aeration) | 0.2-0.4 (pump, compressor) | 0.01-0.05 (pump for mound) | 0.7-1.2 |
| CAPEX (2025, $/m³ treated/day) | $1,500-$3,000 | $2,500-$5,000 | $500-$1,500 (unit only) | $500-$1,500 | $1,000-$2,500 |
| OPEX (2025, $/m³ treated) | $0.50-$1.20 | $0.80-$1.50 (membrane replacement) | $0.30-$0.60 (chemical, energy) | $0.10-$0.30 | $0.60-$1.00 |
| Maintenance Requirements | 1-2 operator hours/week (WSZ series) | 4-6 hours/week (membrane cleaning, monitoring) | 1-2 hours/day (sludge removal, chemical prep) | Annual pump-out, occasional repair | Daily operator, process control |
| Scalability | 1-80 m³/h (modular expansion) | Up to 1,000 m³/h+ (modular) | 4-300 m³/h (per unit) | <1 m³/h (residential) | 100-10,000 m³/h+ |
How MBR and DAF change the train
Key trade-offs sit in the rows, not in a slogan. MBR systems reach lower TSS and lower pathogen counts, which is why reuse jobs specify them, but membrane aeration and cleaning raise OPEX. A DAF system removes fats, oils, grease, and suspended solids, and then needs biology for dissolved COD.
Conventional activated sludge remains the robust choice at 100-10,000 m³/h+, yet the table shows a larger footprint and 0.7-1.2 kWh/m³. Food plants we review put flotation first and biology second, because DAF alone leaves the dissolved fraction. A wider membrane comparison is in MBR Membrane Bioreactor vs Alternatives.
Integrated Plant vs MBR vs DAF Comparison
An integrated plant vs MBR vs DAF comparison is a scope comparison: full train, membrane bioreactor, or flotation pretreatment. The integrated plant covers biology, solids separation, and often nutrient removal, at 0.3-0.6 kWh/m³ and 0.1-0.3 m² per m³ treated per day. Standalone MBR tightens TSS to <1 mg/L and BOD often to <1 mg/L, at 0.6-1.0 kWh/m³ and 0.05-0.2 m² per m³/day. Standalone DAF is the pretreatment box: 0.2-0.4 kWh/m³, 0.05-0.1 m² for the unit only, and 20-50 mg/L BOD before biology.
A buyer who types the comparison between daf wastewater treatement system and mbr wastewater treatment system is comparing a solids-and-FOG step with a biological membrane process. DAF does not remove nitrogen or phosphorus. MBR does, once an anoxic zone and chemical dosing are included, down to <10 mg/L TN and <0.5 mg/L TP in the table. Jobs we review specify DAF when inlet FOG blinds a screen, and they specify MBR when the permit is written on TSS near 1 mg/L.
MBR vs Integrated Wastewater Plant Efficiency
MBR vs integrated wastewater plant efficiency favors the membrane on solids and BOD, and favors the integrated package on energy. Table rows put standalone MBR BOD often under 1 mg/L and TSS at <1 mg/L, against integrated BOD under 10 mg/L and often under 5 mg/L. COD follows the same split: MBR often under 10 mg/L, integrated often under 20 mg/L and listed under 50 mg/L. Energy runs the other way: 0.6-1.0 kWh/m³ for membrane aeration versus 0.3-0.6 kWh/m³ for the integrated plant.
Efficiency claims should be read against a verified reference, not a brochure. The US EPA fact sheet page on membrane bioreactors covers the advantages, applicability, and design features of the process, including case studies. Membrane filtration is a physical barrier, so solids removal is the dependable half of the number. Dissolved COD still depends on the biology ahead of the sheet.
In practice, the efficiency gap narrows or widens with the influent, not with the equipment list. A membrane plant fed steady municipal sewage holds its effluent numbers for years. The same plant fed a shock load of industrial COD will spike, because the barrier catches solids but not dissolved organics. Integrated packages with an equalization compartment buy the stability that a bare membrane train must get from operator attention.
Integrated Wastewater Treatment Plant Footprint vs MBR
Integrated wastewater treatment plant footprint versus MBR is a narrow gap, and both beat conventional tanks. The table lists 0.05-0.2 m² per m³ treated per day for standalone MBR and 0.1-0.3 m² per m³ treated per day for the HydropureWater WSZ series. Conventional activated sludge is 0.5-1.0 m² per m³/day, and a septic drainfield is 1.0-2.0. A 60% reduction versus conventional, and the 70% cut at the Nizwa hospital, describe the integrated package against activated sludge, not against MBR.
Membrane bioreactors hold mixed liquor at high concentration, which lets the biological tank shrink relative to a conventional aeration basin. Part of that saving is spent on membrane cassettes, upstream fine screening, and usually a spare cassette slot for maintenance. Peak wet-weather flow is what actually sets tank size on a cramped site. Where the surface is already paved, an Underground Package Sewage Treatment Plant (WSZ Series) puts the integrated train below grade.
Urban lots we lay out under 0.3 m² per m³/day cannot fit the conventional 0.5-1.0 band without buying more land. MBR wins the footprint contest inside the table. The buried integrated package wins when one excavation is simpler than a membrane hall plus a crane bay.
Effluent Quality and Regulatory Compliance: How Integrated Plants Stack Up
Integrated wastewater treatment plants are specified where the permit is tighter than a secondary-treatment floor. Integrated plants designed for China's GB 18918-2002 Class 1A standard are described here with four effluent targets. Those targets are less than 10 mg/L BOD, less than 50 mg/L COD, less than 10 mg/L TSS, and often less than 1 mg/L TP. Those figures stay as the existing design targets in this comparison.
Projects that must hit Class 1A should still check the current mandatory table before bid.
Under 40 CFR 133.102, the US secondary-treatment regulation, the 30-day average shall not exceed 30 mg/l and the 7-day average shall not exceed 45 mg/l for BOD5. Suspended solids follow the same pattern: 30 mg/l as a 30-day average and 45 mg/l as a 7-day average. Removal for both BOD5 and suspended solids shall not be less than 85 percent on a 30-day average.
A permit may substitute CBOD5, with a 30-day average of 25 mg/l and a 7-day average of 40 mg/l, still at 85 percent removal. The effluent values for pH shall be maintained within the limits of 6.0 to 9.0 unless the exceptions in the regulation are demonstrated. The integrated rows, under 10 mg/L BOD, are tighter than this secondary floor. Near-reuse designs in the opening comparison still cite <1 mg/L BOD, which is a reuse target, not the US secondary minimum.
What Directive (EU) 2024/3019 changed
Earlier guidance in this comparison used Council Directive 91/271/EEC for sensitive-area discharges. Directive (EU) 2024/3019 of 27 November 2024 recasts that directive, published in the Official Journal on 12 December 2024. According to the recast, secondary treatment applies to agglomerations of 1,000 population equivalent and above, with the 1,000 to 2,000 p.e. band given until 31 December 2035. Tertiary treatment is required for urban plants of 150,000 population equivalent and above, with all such plants to comply by 31 December 2039, and it should also be mandatory in agglomerations of 10,000 population equivalent and above that discharge to eutrophication-risk areas.
Quaternary treatment for micropollutants should progressively apply until 2045 for plants of 150,000 population equivalent and above. Member States must bring plants treating 10,000 population equivalent and above toward energy neutrality by 31 December 2045, measured at national level as renewable output versus energy use. Storm-overflow plans aim to hold that pollution to no more than 2% of the annual collected urban wastewater load. Projects that follow US EPA NPDES permits or WHO Guidelines for water reuse can add an MBR module or UV disinfection on the integrated train.
According to Directive (EU) 2024/3019, individual systems are allowed only where a collecting system would produce no environmental or human health benefit, is not technically feasible, or would involve excessive cost. Those systems must still deliver the same level of environmental and human health protection as the secondary and tertiary treatments. A standard septic tank at 30-50 mg/L BOD does not meet that bar on its own.
Compliance risk is higher on the simpler alternatives. Septic effluent in the table still carries 30-60 mg/L TN, which fails many coastal nitrogen limits. Standalone DAF does not remove dissolved organics or nutrients, so it cannot hold a full BOD, COD, TN, and TP permit without biology after it. Adding that missing train later is what inflates both CAPEX and OPEX.
HydropureWater's Medical Wastewater Treatment System is the integrated pattern for hospital effluent, with a 99%+ kill rate for pathogens. Hospital limits often sit above a general municipal rule such as EU Directive 91/271/EEC because disinfection and residue removal are added. That is a different equipment list from a municipal package. Medical jobs we review fail when the municipal train is copied without the disinfection step.
The hospital decision, including cost and compliance data, is set out in Medical Wastewater Treatment System vs Alternatives: 2026 Engineering. Use that page when the waste stream is medical. Use this page when the question is package cost, energy, and footprint against a membrane train.
Cost-Benefit Analysis: Integrated Plants vs Alternatives (2025 Data)
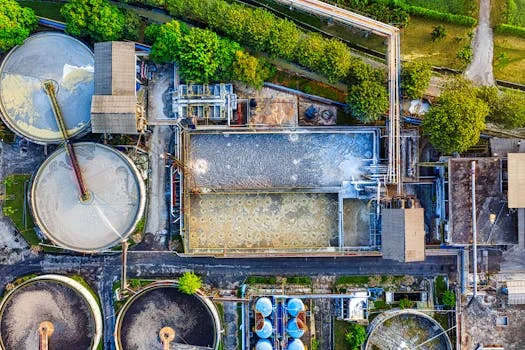
Cost for an integrated plant versus standalone MBR, DAF, septic, and conventional activated sludge is CAPEX plus OPEX, not a sticker price. The table below is the 2025 benchmark set used for that screen.
| System Type | CAPEX (2025, $/m³/day capacity) | OPEX (2025, $/m³ treated) | Typical Payback Period (vs. fines/external service) |
|---|---|---|---|
| Integrated Plant | $1,500 - $3,000 | $0.50 - $1.20 | 3-5 years (industrial/municipal) |
| MBR System (Standalone) | $2,500 - $5,000 | $0.80 - $1.50 | 4-6 years (high reuse demand) |
| DAF System (Standalone) | $500 - $1,500 | $0.30 - $0.60 | 1-3 years (industrial pretreatment) |
| Septic System (Conventional) | $500 - $1,500 | $0.10 - $0.30 | N/A (low initial cost, high hidden costs) |
| Conventional Activated Sludge | $1,000 - $2,500 | $0.60 - $1.00 | 5-8 years (large municipal) |
For integrated plants, CAPEX runs from $1,500 to $3,000 per m³/day of treatment capacity. OPEX sits between $0.50 and $1.20 per m³ treated, including energy, chemicals, and routine maintenance. Read as an integrated wastewater treatment plant vs mbr cost choice, standalone MBR is the higher row at $2,500-$5,000 per m³/day and $0.80-$1.50 per m³. Payback we calculate on real hauling invoices, not on a generic fine.
A conventional septic line can show CAPEX of $500-$1,500/m³/day and OPEX of $0.10-$0.30/m³, before hidden work. Pump-out is typically $300-$500 per year, and a failed drainfield is a capital event. DAF dosing of coagulant and flocculant adds $0.10-$0.30/m³ treated. Seasonal food plants we cost see that chemical line move more than the power bill.
A hospital in São Paulo could face daily fines or hauling charges for a missed discharge limit. Avoiding those charges with an integrated plant was framed here as a payback of 3.5 to 4 years. That illustration is a planning case, not a metered project audit. Regional labor changes the same math, which is why the Wastewater Treatment Plant Cost in Querétaro 2025 breakdown is the local companion to these bands.
What drives the MBR cost premium
The MBR premium is structural, not vendor margin. Membrane cassettes are an imported capital item, and every cassette has a finite service life, so part of the purchase price repeats during the asset's life. Scour air runs on top of process air, which is why the energy row sits higher for standalone MBR. Fine screening upstream of the membranes is also a hard requirement, since hair and fibres weave into the sheets.
Budget the membrane line as a sinking fund from year one. On the projects we support, the replacement reserve is set at procurement, priced at the cassette quote, and reviewed at each service visit. Plants that skip the reserve meet membrane replacement as an unplanned capital event. That single line is what makes a ten-year total-cost comparison honest.
A simple screen for the investment is annual compliance savings, avoided fines, and reuse value, divided by CAPEX plus annual OPEX. Written as used here, the expression is ROI = (Annual savings from compliance + avoided fines + water reuse value) / (CAPEX + Annual OPEX). Use a 10-year Total Cost of Ownership (TCO), not the year-one price.
Decision Framework: How to Choose Between Integrated Plants and Alternatives
The choice between an integrated plant and the alternatives turns on six tests: flow above 50 m³/h, plot limits, reuse or a sensitive discharge, high FOG, thin operator cover, and whether lowest CAPEX outranks OPEX.
| Decision Point | Yes/No Question | Typical Recommendation if 'Yes' |
|---|---|---|
| Flow Rate | Is your average flow rate >50 m³/h? | Consider modular integrated plants or conventional systems for scalability. |
| Space Constraints | Do you have significant space limitations (e.g., urban area, existing facility)? | Integrated plants (e.g., HydropureWater WSZ series) or compact MBR systems. |
| Effluent Quality | Are you discharging to a sensitive water body or aiming for water reuse? | Integrated plants with MBR modules or standalone MBR systems. |
| Influent Characteristics | Does your wastewater have high FOG or suspended solids (e.g., food processing)? | Integrated plants with DAF pretreatment or standalone HydropureWater DAF system. |
| Operational Complexity | Is operator availability or technical expertise limited on-site? | Highly automated integrated plants with remote monitoring. |
| Budget Priority | Is lowest initial CAPEX the absolute highest priority, even with higher OPEX risks? | Septic systems (for very low flow/rural) or basic conventional systems. |
A weighted score can break a tie. One split used on these projects is effluent quality (30%), footprint efficiency (20%), energy consumption (15%), CAPEX (20%), and OPEX (15%). An integrated plant scores on quality and footprint. A septic tank scores on low CAPEX and fails the effluent weight.
Procurement managers should run this checklist before a purchase order:
- Verify local regulatory limits and future projections.
- Assess influent variability (flow, load, temperature) and potential for shock loads.
- Calculate a 10-year Total Cost of Ownership (TCO) including CAPEX, OPEX, and potential fines.
- Evaluate vendor experience, support, and proven track record in similar applications.
- Consider modularity and scalability for future expansion.
For high FOG loads, a HydropureWater DAF system inside the wider train is the usual fix. Single-operator sites we support pick the 1-2 operator hours/week band when nobody is on the night shift. A daily conventional crew is a payroll line, not a treatment step.
Who this is for
An integrated wastewater treatment plant fits buyers with flows of 1-80 m³/h, a tight plot, and a permit on BOD, COD, TN, and TP together. Hospitals, food plants, and sites with no sewer are the core group. Standalone MBR remains the right row when reuse quality, not capital, sets the spec.
Who should look elsewhere
Septic systems remain the fit for flows <1 m³/h with land for a drainfield and a loose limit. A DAF-only purchase fits pretreatment, not a final discharge to a sensitive water. Conventional activated sludge still fits flows of 100-10,000 m³/h+ where land is cheap and a full crew exists. Short camps under two years should price the civil works before they copy a hospital spec.
Next step
Send average flow, peak factor, inlet COD, FOG, the permit table, and the plot limit. The capacity and cost review places that packet on the integrated, MBR, or DAF row using the 2025 bands above. Do not send a budget number alone. Without the permit and the peak factor, the CAPEX band is a guess.
Frequently Asked Questions
Common questions on integrated plants turn on cost, the COD range, maintenance hours, and what replaces a septic tank.
What is the difference between an integrated wastewater treatment plant and a conventional plant?
An integrated wastewater treatment plant puts biological, physical, and chemical stages into one compact, often pre-engineered unit. A conventional plant uses separate tanks built on site, so land and civil works are larger. The integrated layout is associated with up to a 60% footprint reduction versus conventional treatment. The table lists WSZ-class maintenance at 1-2 operator hours/week, against a daily operator for activated sludge.
Can integrated plants handle industrial wastewater with high COD?
Yes. Integrated plants in this comparison are sized for industrial COD up to 5,000 mg/L when an MBR module or a DAF module is included. DAF takes FOG and suspended solids out first. Biology, or the membrane tank, then cuts the dissolved COD that flotation cannot touch. Standalone DAF in the table still leaves 50-150 mg/L COD, so it is pretreatment. High-COD lines we review miss their permit when that second stage is left out of the order.
What are the maintenance requirements for an integrated plant?
Maintenance for a HydropureWater WSZ series plant is 1-2 operator hours per week for checks, calibration, and sludge handling. Standalone MBR in the same table needs 4-6 hours/week for membrane cleaning and monitoring. Standalone DAF needs 1-2 hours/day for sludge removal and chemical preparation. Conventional activated sludge needs a daily operator and process control. The weekly walkdown is not the cost driver on an MBR; membrane replacement inside the $0.80-$1.50 per m³ OPEX band is.
How much does an integrated wastewater treatment plant cost?
The CAPEX for an integrated wastewater treatment plant is $1,500 to $3,000 per m³/day of treatment capacity in the 2025 benchmarks. OPEX is $0.50 to $1.20 per m³ treated, including energy, chemicals, and routine maintenance. Standalone MBR sits higher, at $2,500 to $5,000 per m³/day and $0.80 to $1.50 per m³ treated, because of membrane aeration and replacement. A reuse limit or a scarce local crew pushes a project to the top of the band.
What is the best alternative to a septic system for a small business?
A small business that has outgrown septic treatment should look at a small integrated plant, a compact MBR, or DAF pretreatment. Septic rows in the table fit flows under 1 m³/h and effluent BOD of 30-50 mg/L. Choose the integrated plant when the permit needs BOD under 10 mg/L on a tight plot. Choose MBR when reuse or TSS under 1 mg/L is the limit. Choose DAF when FOG is the load and biology still follows it.