
Why Port Angeles Transportation Wastewater Is Its Own Engineering Problem
Generic MBR-versus-CAS comparisons often overlook the specific mix of contaminants, hydraulics, and climate defining ferry terminals, shipyards, truck depots, and rail yards on the Olympic Peninsula. Influent at these sites is not standard domestic sewage—it carries antifreeze and glycol from radiator flush stations, hydraulic oil from cylinder repair bays, parts-washer solvents and FOG from degreasing pits, suspended road grit from drive-through wash bays, and high-solids wash-down surges when a ferry unloads or a shipyard pressure-washes a hull. Daily flows swing sharply: a ferry terminal may run 200 m³/d on a routine service day and 600 m³/d during a shipyard dry-dock wash-down window, a 3× peaking factor that conventional activated sludge struggles to absorb without sludge loss over the weir.
The reuse benchmark for a Port Angeles facility is the Port Hadlock UGA Sewer Facility Plan (Sept 2008), which sets Class A reuse criteria at BOD 30 mg/L, TSS 30 mg/L, turbidity 2 NTU monthly (5 NTU at any time), and total coliform 2.2/100 mL—values the WA Department of Ecology typically applies as a proxy on the Peninsula. The regional solids receiver is the Port Angeles WWTP, which charges approximately $0.22/gallon for unthickened sludge (per Port Hadlock 2008 plan, S2), a figure that anchors OPEX for either technology. Climate compounds the problem: the Olympic Peninsula records 60–80 inches of annual rainfall and winter ambient temperatures of 0–5 °C, conditions that depress CAS nitrification rates and stress clarifier settling while leaving MBR with extended SRT largely unaffected.
How Each System Treats the Transportation Wastewater Stream
Conventional activated sludge handles the bulk BOD load in an aeration tank, then sends mixed liquor to a secondary clarifier where gravity settling separates biomass from clarified supernatant. Settled sludge is split into return activated sludge (RAS) and waste activated sludge (WAS). The clarifier is the single point of failure: a glycol or emulsified-oil slug from a parts washer lifts sludge blankets, a hydraulic surge from a ferry wash-down scours floc over the weir, and winter mixed-liquor temperatures below 7 °C trigger bulking filaments that pin the blanket against the surface. These failure modes are not recoverable inside the activated-sludge envelope; they require operator intervention and often a full clarifier dump.
MBR eliminates the clarifier. Mixed liquor at 10,000–15,000 mg/L MLSS (per Port Hadlock 2008 plan, S2) is drawn through submerged 0.1–0.4 μm PVDF membranes; clean permeate is pulled under vacuum and the rejected biomass stays in the basin. The absolute physical barrier retains emulsified oil droplets, FOG, and the dispersed particulates that would otherwise float out of a clarifier, so a 200 mg/L oil slug from a hydraulic repair bay is captured and biodegraded in the same tank rather than escaping to the receiving sewer. Operating at MLSS concentrations 2–4× higher than CAS, MBR decouples HRT from SRT: F/M ratios of 0.05–0.15 d⁻¹ are stable, SRT of 40–60 days is achievable, and the long SRT ensures the system continues nitrifying at 5 °C mixed-liquor temperatures where a CAS basin would stall.
For shipyard or ferry wash water with potential pathogen loading, the 0.04–0.2 μm membrane cutoff (per Grasmick et al., S4) retains nearly all bacteria and most viruses. MBR permeate reaches a Silt Density Index below 3—the threshold required for RO feed without further clarification, which is critical for any deck-wash or cooling-tower reuse loop at a ferry terminal. Engineers evaluating skid-packaged systems for this duty should review an integrated MBR membrane bioreactor system sized to the diurnal pattern described above.
MBR vs CAS Operating Envelope: Parameters an Engineer Needs on One Page
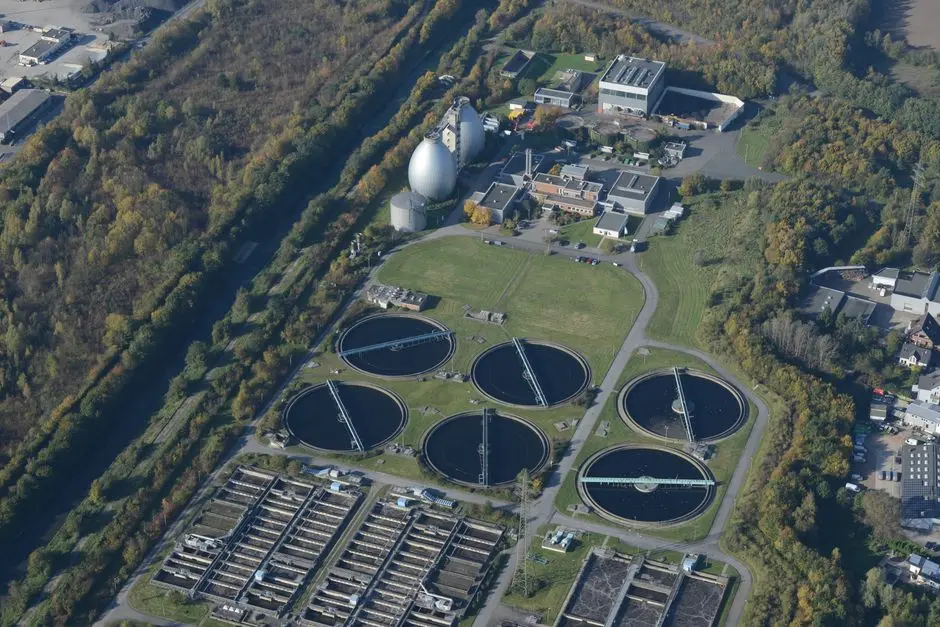
The table below consolidates the 2026 design envelope for both technologies based on the contaminant mix described above. MBR values reflect high-MLSS, long-SRT operation as documented in the Port Hadlock 2008 plan and the 2009 Banu et al. A2O-MBR study; CAS values reflect typical extended-aeration operation at 2,000–4,000 mg/L MLSS (per S2, S3).
| Parameter | MBR (2026 typical) | CAS (2026 typical) |
|---|---|---|
| MLSS | 8,000–15,000 mg/L | 2,000–4,000 mg/L |
| HRT | 4–8 h | 6–12 h |
| SRT | 20–60 d (40–60 d at upper end) | 5–15 d |
| F/M ratio | 0.05–0.15 d⁻¹ | 0.20–0.50 d⁻¹ |
| Effluent TSS | <5 mg/L | 10–30 mg/L (tertiary polish required for <10 mg/L) |
| Effluent BOD | <5 mg/L | 10–30 mg/L |
| Turbidity | <1 NTU | 5–15 NTU |
| Membrane pore size | 0.1–0.4 μm PVDF (0.04–0.2 μm cutoff retains bacteria/virus) | N/A — gravity settling |
| Footprint factor | 0.4–0.6× of CAS (DF series flat-sheet module rated ~60% saving) | 1.0× baseline |
MLSS and SRT are the two primary drivers for MBR selection in Port Angeles. A 10,000–15,000 mg/L basin is 3–4× more concentrated than a 3,000 mg/L CAS basin, allowing the same BOD load to be processed in a tank one-third the volume, while the long SRT keeps the biomass metabolically active when winter mixed-liquor temperatures drop to 5–7 °C. Effluent quality at <5 mg/L TSS and <1 NTU is reuse-ready; CAS effluent at 10–30 mg/L TSS requires cloth-media disc filters or DAF to meet the Port Hadlock Class A 30 mg/L TSS threshold, and a separate polishing stage to reach <10 mg/L for strict consent requirements.
What It Costs to Build and Run Each Option in 2026
Indicative 2026 turnkey CAPEX for skid-integrated, EPC-scope plants is $80–$220 per m³/d for CAS and $180–$420 per m³/d for MBR (HydropureWater 2026 engineering comparison, S3). The cost spread is wide because CAPEX scales with influent strength—a ferry-terminal wash stream with periodic oil contamination requires thicker tanks and larger blowers than a dilute rail-depot effluent—and material selection. OPEX is $0.10–$0.22/m³ for CAS and $0.18–$0.42/m³ for MBR. The MBR premium is decomposable: 30–50% of MBR energy is membrane scouring air; CIP chemicals run every 1–4 weeks; and membrane replacement amortizes over 5–8 years (per S3). MBR generates 20–40% lower waste activated sludge volume than CAS at matched SRT, providing a direct OPEX saving once the local $0.22/gallon Port Angeles WWTP sludge tip fee is applied.
| Cost line | CAS (1,000 m³/d greenfield) | MBR (1,000 m³/d greenfield) |
|---|---|---|
| Turnkey CAPEX | $80,000–$220,000 | $180,000–$420,000 |
| Annual OPEX (energy, CIP, labor) | $36,500–$80,300 ($0.10–$0.22/m³) | $65,700–$153,300 ($0.18–$0.42/m³) |
| WAS volume at matched SRT | Baseline (1.0×) | 0.6–0.8× of CAS |
| Sludge disposal at $0.22/gallon (Port Angeles WWTP) | Baseline | 20–40% lower annual tip cost |
| Tertiary filtration to <10 mg/L TSS | Required (cloth-media disc / DAF) | Not required — membrane meets limit directly |
For a 1,000 m³/d ferry-terminal retrofit, assume a CAPEX premium of $200,000, annual WAS savings of $4,800, and avoided cloth-media disc filtration CAPEX of $40,000 amortized over 10 years. If the terminal uses MBR permeate to displace 30% of its deck-wash and bilge-flush freshwater purchases at $4.50/m³, the avoided water purchase adds $49,275/year, lifting the net benefit to approximately $54,000/year and compressing the payback period to 3.7 years. This falls within the typical 3–6 year MBR payback window (per S3) where reuse, land constraints, or strict discharge limits drive the technology choice.
Decision Matrix: Which System Fits Your Site
The table below provides recommendations calibrated to the Olympic Peninsula's reuse framework, climate, and local sludge-disposal economics.
| Facility profile | Recommended technology | Reasoning |
|---|---|---|
| Large ferry terminal, deck-wash or bilge reuse, <2,000 m³/d | MBR | Reuse-grade permeate, 40–60% footprint saving, tolerated ferry wash-down peaks |
| Shipyard with cold-weather shock loads and intermittent high-FOG flows | MBR | 10,000–15,000 mg/L MLSS absorbs oil/FOG slugs, no clarifier to wash out |
| Rail maintenance depot, stable flow, no reuse obligation | CAS with disc-filter polish | Lower CAPEX, ample land, established operator skill base |
| Truck fleet wash bay, <500 m³/d, constrained site | MBR | Footprint 40–60% smaller, modular capacity build-out |
| Small marina, <200 m³/d, summer-peaking | CAS or SBR | Lowest CAPEX at small scale, no reuse driver |
Three default rules apply across these profiles. First, any industrial reuse obligation or constrained Olympic Peninsula site defaults to MBR—the 40–60% footprint reduction enables installation on tight parcels, and the DF series PVDF flat sheet membrane module is rated at roughly 60% smaller footprint than an equivalent CAS train. Second, greenfield municipal discharge with no reuse obligation still favors CAS once tertiary filtration is priced in (per S3). Third, an existing CAS aeration basin can be repurposed as an MBR zone by adding submerged cassettes and removing the clarifier, which is relevant for older Port Angeles industrial sites with limited area. Cold-climate operation is the deciding factor at sites where winter mixed-liquor temperatures fall below 7 °C: MBR's high SRT and MLSS tolerate the conditions, while CAS clarifiers are vulnerable to bulking that forces plant shutdowns.
For facilities whose influent profile trends toward higher BOD and FOG, the same technology logic applies but tank sizing shifts. Engineers working through that subset should cross-reference the MBR vs activated sludge for high-BOD FOG wastewater footprint guide.
Frequently Asked Questions
What is the main difference between MBR and conventional activated sludge for a Port Angeles ferry terminal?
MBR replaces the secondary clarifier with a 0.1–0.4 μm PVDF membrane, operating at 10,000–15,000
Frequently Asked Questions
Is MBR better than activated sludge for a ferry terminal in Port Angeles?
For a Port Angeles ferry terminal, Membrane Bioreactor (MBR) technology is generally superior to Conventional Activated Sludge (CAS) due to the limited land footprint and the stringent effluent requirements for discharging into the sensitive marine environment of the Strait of Juan de Fuca. MBR systems consistently achieve lower turbidity (<0.2 NTU) and higher nutrient removal compared to CAS, making them better suited for meeting Washington State Department of Ecology surface water discharge standards.
How cold can an MBR system operate on the Olympic Peninsula?
MBR systems remain biologically active at wastewater temperatures as low as 8°C to 10°C, which are typical for winter conditions in Port Angeles. While nitrification rates slow significantly below 12°C, the physical barrier of the membrane ensures that biomass is retained regardless of settling characteristics, allowing for stable operation at low temperatures provided that the hydraulic retention time is adjusted to compensate for decreased microbial kinetics.
What is the 2026 cost per cubic meter for an MBR vs CAS wastewater plant?
As of 2026, the estimated capital cost for MBR systems ranges between $1.80 and $2.40 per cubic meter of daily capacity, compared to $1.20 to $1.60 for CAS. While MBR carries a higher initial investment and 15% to 25% higher energy consumption due to membrane scouring air requirements, the lifecycle cost is often offset by reduced sludge disposal fees and the avoidance of chemical tertiary treatment stages required to meet discharge compliance.
Can MBR handle glycol and hydraulic oil from transportation equipment maintenance?
MBR systems are highly sensitive to high concentrations of hydrocarbons and glycol, which can cause membrane fouling or inhibit the biological process. Pre-treatment via an oil-water separator and an equalization tank is mandatory to ensure influent concentrations remain below 50 mg/L of oil and grease; without this, the membrane permeability will drop rapidly, necessitating frequent chemical clean-in-place (CIP) cycles that shorten the operational lifespan of the membranes.
How long does it take for an MBR upgrade to pay back at a transportation facility?
The payback period for an MBR upgrade at a transportation facility typically ranges from 7 to 12 years, depending on the volume of wastewater treated and the local municipal sewer rates. For facilities in Port Angeles, the return on investment is driven primarily by the reduction in off-site hauled waste costs and the ability to reclaim high-quality treated effluent for non-potable uses, such as equipment wash-down or dust control.