
What High-BOD FOG Process Wastewater Actually Looks Like in an F&B Plant
For high-BOD, FOG-rich food and beverage process wastewater, the influent envelope is wider and more punishing than most municipal datasets suggest. Slaughterhouse and meat-processing streams run BOD 500–4,000 mg/L, COD 1,000–15,000 mg/L, FOG 300–2,000 mg/L, TSS 300–6,000 mg/L, total solids 400–8,000 mg/L, and TN 50–800 mg/L (Water, 2021). Dairy, brewery, and edible-oil operations sit inside the same envelope on a typical day and spike past it during CIP dumps, whey losses, or fryer turnover. FOG is the deciding variable: free oil blinds submerged membranes within hours and coats MBBR carriers within days, so the pretreatment choice (DAF, fat trap, or dissolved-air flotation with coagulant) is fixed before MBR vs MBBR is even on the table. Conventional activated sludge struggles in this band because high FOG, high BOD, and 20–35 °C temperature swings trigger bulking and poor settleability — which is precisely the gap MBR and MBBR were designed to fill.
Reuse turbidity targets the buyer is usually chasing are tight: cooling-tower make-up at <10 NTU, CIP rinse at <5 NTU, and boiler feed at <1 NTU. Whether MBR or MBBR can hit those numbers is the first question in any 2026 equipment selection. The table below summarises the F&B influent envelope most plants need to design against.
| Parameter | Typical F&B range (slaughterhouse / meat / dairy / brewery) | Why it matters for MBR vs MBBR |
|---|---|---|
| BOD₅ | 500–4,000 mg/L | Sets aeration tank volume and HRT |
| COD | 1,000–15,000 mg/L | Drives MBR flux and MBBR carrier fill |
| FOG | 300–2,000 mg/L | Must be reduced to <50–100 mg/L before membranes |
| TSS | 300–6,000 mg/L | Direct membrane foulant; MBBR clarifier load |
| Total nitrogen | 50–800 mg/L | Defines whether a separate anoxic stage is needed |
| Temperature | 20–40 °C | High T reduces MBR scour air but increases FOG emulsification |
How MBR Works on FOG-Laden Food and Beverage Streams
A submerged PVDF MBR system replaces the secondary clarifier with flat-sheet or hollow-fibre membranes immersed directly in the aeration tank. Pore size sits at 0.1–0.4 μm, mixed-liquor MLSS is run at 8,000–12,000 mg/L, HRT at 6–14 h, and SRT at 20–40 d — well above the 3–10 d typical of CAS. The membranes act as an absolute physical barrier: TSS removal exceeds 99% and effluent turbidity in F&B plants is routinely 0.5–2 NTU, often suitable for direct reuse without sand filtration. On a textile wastewater comparative study, MBR hit 91% COD, 99.4% TSS, and 80% color removal at 1.3 d HRT (UPC thesis, 2017), and a submerged MBR on slaughterhouse influent exceeded 98% COD removal (Water, 2021).
The FOG cost is real and it is what kills MBR economics in food plants. Even with DAF upstream to <100 mg/L FOG, residual emulsified oil reaching the tank causes irreversible fouling: flux drops 30–60% between cleans, CIP frequency stretches from a target 4–8 weeks toward 1–4 weeks, and membrane life shortens from a 7–10 year baseline (UtilityRadar, 2026) to 4–6 years in heavy FOG duty. Scour-air blowers add 30–50% to aeration energy versus a comparable CAS or MBBR tank, and membrane cassette replacement is a 2–4 day shutdown most plants can ill afford.
How MBBR Handles High-BOD FOG Wastewater
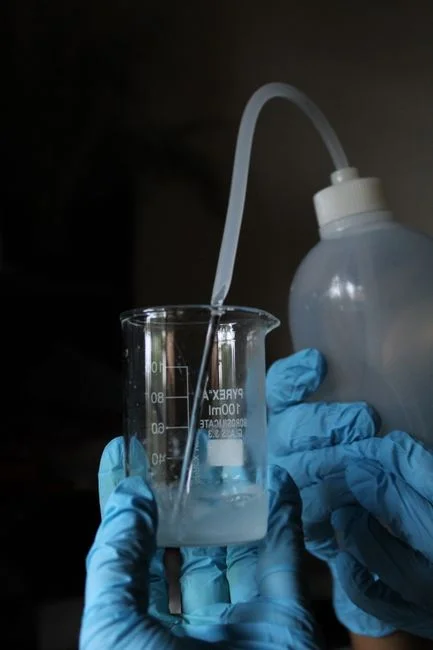
MBBR keeps the aeration tank but fills it with floating plastic carriers — typically 10–25 mm shapes in the Kaldnes K1/K3/K5 family at 500–800 m²/m³ of protected surface area, though some high-porosity virgin-PE chips claim more than 5,500 m²/m³ (Ecologix). Biomass grows as a thin biofilm inside the protected pore structure, kept thin by shear from the mixing air; MLSS in the mixed liquor runs much lower, at 3,000–5,000 mg/L, because most of the active biomass is attached. For medium-strength F&B streams, HRT is 4–10 h. On textile wastewater the same UPC comparison found MBBR at 82% COD and 73% TSS removal at just 1 d HRT — comparable to CAS on COD but at half the volume (UPC thesis, 2017).
On FOG, the carrier ecosystem behaves very differently from a membrane. The biofilm sloughs and re-grows on the protected carrier surface, so a short FOG spike rarely kills the system the way it kills a membrane. Sustained emulsified oil is still a problem: it coats carriers, drops active surface area, and may force a tank dump-and-recover — but recovery is hours, not weeks, and inventory is plastic beads, not membrane cassettes. Operator burden is what wins this row: no membrane CIP, no scour-air balance, no cassette swap-out. Routine work is carrier inspection, screen integrity, and dissolved-oxygen control — typically 2–4 h per week in a 500 m³/d food plant.
MBR vs MBBR Head-to-Head: Reuse Turbidity, FOG Tolerance, Footprint, Cost
This is the decision core. The numbers below are 2026 F&B-plant ranges; the textile figures from the UPC study are flagged where they are the only direct citation available.
| Criterion | MBR (submerged PVDF) | MBBR + clarifier | Source / note |
|---|---|---|---|
| Reuse turbidity | 0.5–2 NTU (direct reuse often possible) | 5–20 NTU (clarifier outlet) | MBR is the reuse winner |
| TSS removal | 99–99.4% | 70–80% | UPC thesis 2017; UtilityRadar 2026 |
| FOG tolerance without DAF | Poor; flux collapses within hours of a spike | Recovers from spikes; biofilm sloughs and re-grows | Operator field experience |
| Footprint vs CAS | ~50% | ~30–40% | UtilityRadar 2026; MBBR typically smallest |
| Effluent stability | Insensitive to sludge settleability (no clarifier) | Depends on working secondary clarifier or DAF polish | — |
| CAPEX (2026, F&B service) | Baseline | 40–60% lower at equal hydraulic capacity | UPC: 68.4% CAPEX saving on textile; F&B range is narrower once DAF pretreatment is included |
| OPEX (2026, F&B service) | 25–60% higher (membrane replacement + scour air) | Baseline | UPC found similar OPEX in textile; F&B membrane cost and energy gap widens this |
| Operator hours / week (500 m³/d food plant) | 8–15 h | 2–4 h | HydropureWater field data, 2026 |
| Membrane replacement cycle | 7–10 yr baseline; 4–6 yr in heavy FOG | None | UtilityRadar 2026 |
Read the table by constraint. If reuse turbidity under 2 NTU is the spec, MBR wins outright. If FOG spikes are routine and the discharge goes to sewer or irrigation, MBBR wins outright. The footprint delta is small enough that it usually does not drive the decision. The CAPEX gap and the operator-hours gap are where MBBR is hard to argue with — and they are the reason most 2026 F&B plants are at least looking at a DF-series flat-sheet MBR module only for the polish stage. Upstream of either, a properly sized dissolved air flotation (DAF) unit is non-negotiable on this envelope: large-scale DAF hits ~70% COD, 55% TN, 70% TP, and 85% FOG removal on slaughterhouse wastewater (Water, 2021).
Where Each System Loses: Failure Modes on FOG-Laden Streams
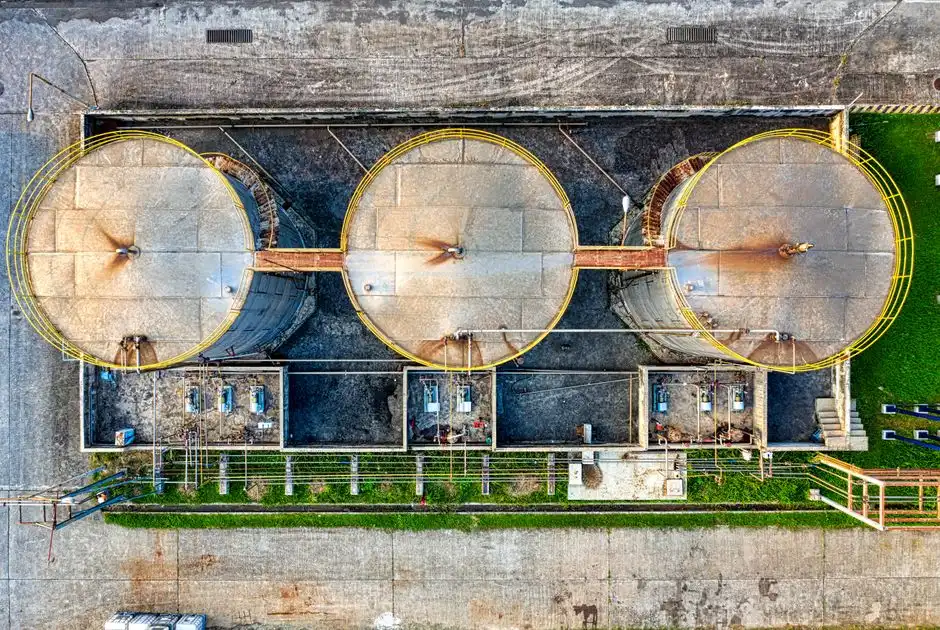
MBR failure modes in F&B service are dominated by FOG. Irreversible fouling from emulsified oil that slips past DAF, capillary clogging in hollow-fibre modules, MLSS foaming during CIP dumps, scour-air blower failure, and the 7–10 year membrane replacement event (4–6 years in heavy FOG) are the patterns a buyer has to budget for. Cassette replacement is a multi-day shutdown and a six-figure spares order.
MBBR failure modes look different. The most common is carrier carry-over when a downstream screen fails — the carriers are buoyant and small enough to escape through a torn screen or a stuck spray nozzle. Excess biofilm in high-BOD service can also clog the moving bed, and surfactant-rich F&B streams trigger foam events that need defoamer dosing and freeboard. Carrier inventory is gradually lost; 1–3% per year is a reasonable budget line, so a plant should plan to top up carriers over a 5–10 year horizon. Both systems share the same prerequisite: consistent FOG removal upstream via DAF or an equivalent fat trap. Bar screening ahead of the DAF also matters more than most plant specs acknowledge — a GX rotary bar screen set at 3–5 mm aperture keeps rags, labels, and meat trimmings out of the DAF, which keeps DAF performance consistent, which keeps FOG out of the biological stage.
When the Hybrid MBBR → MBR Train Is the Right 2026 Answer
Most plants chasing reuse-grade water with high FOG do not have to choose. The hybrid MBBR → MBR train takes the FOG and BOD shock load in the MBBR and lets the downstream MBR polish to reuse turbidity without ever seeing raw feed. The UPC pilot found the hybrid hit 93% COD, 99% TSS, and 85% color removal at 1 d HRT, with NPV positive and 18% IRR on textile scale (UPC thesis, 2017) — and the operating logic translates cleanly to F&B once FOG is reduced to <100 mg/L upstream of the MBBR.
For a 500–2,000 m³/d F&B plant, the practical picture looks like this:
| Parameter | MBR on raw feed | Hybrid MBBR → MBR | Note |
|---|---|---|---|
| Membrane life | 4–6 yr (heavy FOG) | 7–10 yr (membrane sees polished feed) | UtilityRadar 2026 baseline |
| CIP frequency | 1–4 weeks | 6–12 weeks | Operator field data, 2026 |
| Reuse turbidity | 0.5–2 NTU | 0.5–2 NTU | Membrane polish in both trains |
| Footprint vs CAS + sand filter | ~50% | ~60% | Hybrid is larger than MBR alone |
| Operator hours / week | 8–15 h | 5–9 h | Lower than MBR-on-raw, higher than MBBR alone |
| CAPEX vs MBR-on-raw | Baseline | 10–20% higher | Adds MBBR tank, sieve, blowers |
| Reuse-water payback | 3–6 yr | 2–4 yr | Reduced membrane OPEX + reuse credit |
For a deeper treatment-train comparison (CAS, SBR, MBR, MBBR on the same axes) see our broader MBR vs MBBR comparison, which covers non-F&B influents in more detail.
Decision Framework: Pick MBR, MBBR, or Hybrid in 2026
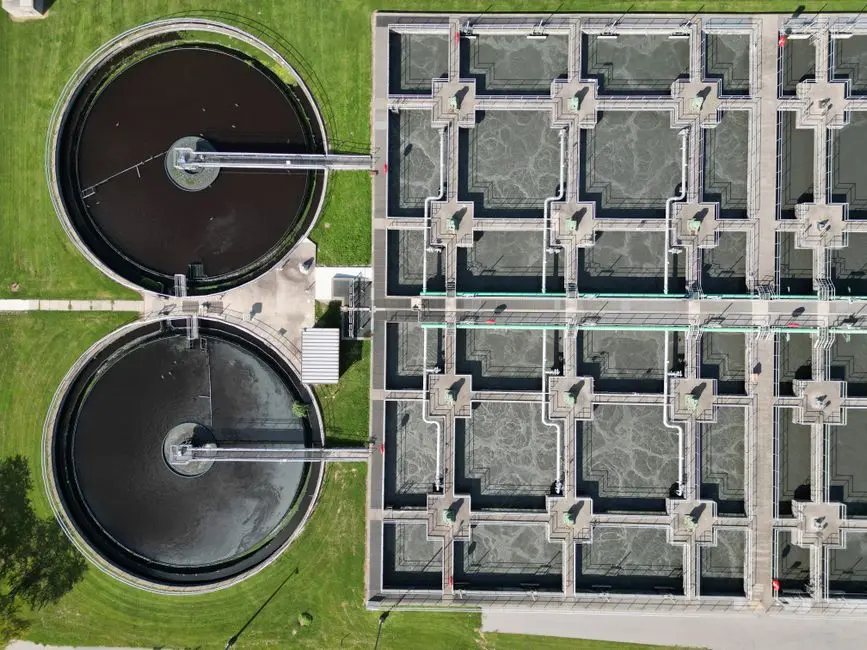
The decision collapses to three rules a plant engineer can apply without re-reading the article:
- Pick MBBR when the plant discharges to sewer or irrigation with no tight turbidity limit, FOG spikes are routine, operator hours are capped, and CAPEX is constrained. MBBR is the workhorse.
- Pick MBR when reuse turbidity must be under 2 NTU, footprint is very tight, FOG is already consistently below 50 mg/L after DAF, and the plant has skilled operators and a maintenance budget for membrane replacement every 5–7 years. For F&B reuse specs and compliance details, the MBR effluent quality for food processing in 2026 guide is the companion read.
- Pick the hybrid MBBR → MBR train when both reuse turbidity and FOG resilience are required. This is the dominant 2026 configuration for 500–2,000 m³/d F&B plants that need to hit a reuse spec without paying for membrane replacement on a 4-year cycle. For dairy in particular, the dairy wastewater DAF + MBR process guide walks through a 1,000 m³/d hybrid case study.
Frequently Asked Questions
Which delivers lower reuse turbidity, MBR or MBBR, on FOG-rich food wastewater?
MBR. Submerged PVDF membranes at 0.1–0.4 μm routinely deliver 0.5–2 NTU effluent in F&B service, while an MBBR followed only by a clarifier sits at 5–20 NTU. If the reuse spec is under 2 NTU, MBR is the only single-stage answer; otherwise a hybrid MBBR → MBR train is needed.
How many operator hours per week does each system really need on a 500 m³/d food plant?
MBBR runs at 2–4 h/week (carrier inspection, screen integrity, DO control), and MBR runs at 8–15 h/week once membrane CIP, scour-air balance, and periodic cassette work are included (HydropureWater field data, 2026). The gap is the single biggest driver of operator-burden complaints in 2026 plant surveys.
Do I still need DAF upstream if I run MBBR instead of MBR?
Yes. Both systems fail without FOG reduction upstream. Large-scale DAF on slaughterhouse wastewater removes roughly 70% COD, 55% TN, 70% TP, and 85% FOG (Water, 2021), and most F&B plants target <50–100 mg/L FOG into the biological stage to keep carriers functional and membranes alive.
What CAPEX saving should I expect from MBBR vs MBR on the same F&B duty?
In F&B service, a realistic 2026 range is 40–60% lower CAPEX for MBBR of equal hydraulic capacity, because membranes, cassettes, permeate piping, and scour blowers are eliminated. The UPC textile study found a wider 68.4% CAPEX gap, but F&B plants carry a higher DAF pretreatment cost which narrows the delta in practice.
How long do MBR membranes last on FOG-heavy food wastewater?
A 7–10 year baseline is realistic for municipal and low-FOG industrial duty (UtilityRadar, 2026). On heavy FOG food and beverage streams the cycle shortens to 4–6 years unless the membrane sees a polished (MBBR-upstream) feed, in which case life extends back toward the 7–10 year baseline.