Why PFAS Forces a Different Treatment Train in 2026
On 30 July 2025 the U.S. Environmental Protection Agency designated PFAS as a critical pollutant, fixing PFOA and PFOS maximum contaminant levels at 0.004 parts per trillion (ppt) and a Hazard Index of 1 for any mixture of PFNA, PFHxS, HFPO-DA (GenX), and PFBS (per S2). Procurement teams are now working backward from that compliance date, and the chemistry itself explains why conventional plants cannot meet it. The carbon–fluorine bond energy sits near 485 kJ/mol, and the EPA's own 2012 reference puts the environmental half-life of PFOA at up to 92 years (per S4, AFIT/EPA 2018 presentation). A secondary clarifier designed for BOD, COD, and TSS operates in the parts-per-million regime; PFAS compliance operates in parts per trillion, which is roughly seven orders of magnitude tighter. That gap is what forces the engineered AOP train onto the bid list in 2026.
Three implications follow for an industrial engineer (semiconductor, plating, textile, or PFAS-using manufacturer). First, adsorption-only systems (GAC, ion exchange, RO) transfer the contaminant to a solid waste that must be landfill-disposed or incinerated — a liability under the EPA's April 2024 PFAS NPDWR. Second, biological treatment is not a meaningful barrier for the parent compounds because microbes do not cleave the C–F backbone at environmental timescales. Third, any reactor recommendation has to be defensible against an MCL that is below the kinetic limit of one-pass radical oxidation, which is why AOP almost always appears upstream of a polishing step rather than as a standalone finish. The rest of this article is built around that conclusion: AOP is the right answer, but only after a triage step, only as part of a defined train, and only with a sizing basis that an engineer can actually defend.
Triage First: When an AOP System for PFAS Wastewater Is the Right Choice
An AOP system for PFAS wastewater is the right primary answer when the engineer needs destruction rather than transfer, when the discharge path is to surface water or reuse (no spent-media landfill), or when influent total organic carbon (TOC) is high enough to swamp downstream GAC. The AFIT data on AFFF-impacted matrices shows source water TOC climbing from ~3 mg/L to ~100 mg/L once AFFF enters the stream (per S4, citing Schmidt 2017). At that level, dissolved organics outcompete PFAS for adsorption sites and a GAC vessel that should last 12 months may exhaust in 6 weeks. AOP is the wrong primary answer when flows are very large, PFAS is the only regulated analyte, and a capture-and-haul GAC or ion-exchange train is cheaper to install and operate. The decision below separates these cases before reactor selection begins.
| Decision Criterion | AOP Is the Right Choice | GAC / IX / RO Alone Is Cheaper |
|---|---|---|
| Influent TOC | > 20 mg/L (organics will exhaust GAC fast) | < 5 mg/L (clean water, adsorption sites intact) |
| Compliance goal | Destruction (no PFAS-laden spent media) | Capture (spent media sent to permitted disposal) |
| Discharge path | Surface water, reuse, or zero-liquid-discharge | Sanitary sewer with industrial discharge permit |
| Target effluent | < 0.004 ppt PFOA/PFOS (EPA 2025 MCL) | Higher local limit, or non-potable reuse |
| Flow regime | Low-to-mid flow with high PFAS | Very high flow with low ng/L PFAS |
Two practical consequences. First, the 0.004 ppt MCL is below the single-pass kinetic limit of hydroxyl radical oxidation, so AOP is virtually always followed by GAC or ion-exchange polishing — AOP alone is rarely a finished answer. Second, the AFIT AFFF work confirms that the AOP-then-GAC train is the dominant 2026 architecture, not because AOP destroys all PFAS, but because it strips the TOC that would otherwise consume the GAC (per S4).
How AOP Actually Breaks PFAS Molecules
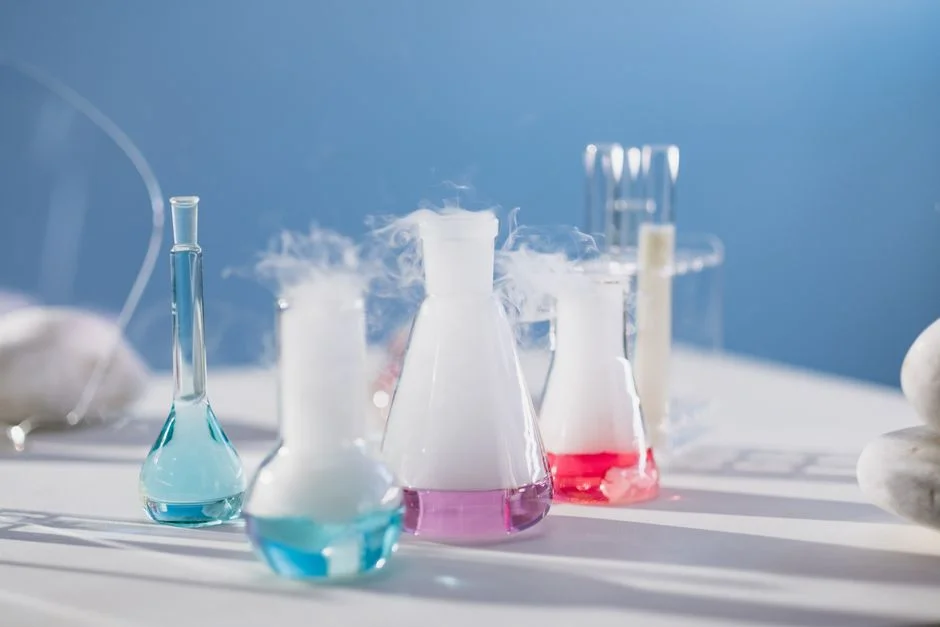
Advanced Oxidation Processes are defined by the in-situ generation of radicals strong enough to attack the C–F bond: the hydroxyl radical (•OH) at a standard reduction potential of E° = +2.8 V, and the sulfate radical (SO₄•⁻) at E° = +2.5 to +3.1 V depending on pH. Both attack the perfluorinated chain and progressively shorten it. The Fenton reaction is the canonical •OH generator: Fe²⁺ + H₂O₂ → Fe³⁺ + •OH + OH⁻ (per S2). UV photolysis of H₂O₂ or persulfate (S₂O₈²⁻) produces the same radicals without the iron sludge penalty.
The destruction pathway runs from long-chain PFAS (PFOA C8, PFOS C8) through shorter-chain PFCAs and PFSAs — PFHpA (C7), PFHxA (C6), PFPeA (C5), PFBA (C4) — and ideally on to CO₂ and F⁻. Full mineralization is rare in one pass; shorter-chain PFAS (PFPeA, PFHxA flagged specifically in S4) are often the actual effluent concern, because they are more mobile and more difficult to remove by adsorption than their parents. The AFIT team explicitly listed "optimal H₂O₂ concentration and UV contact time for AFFF matrices" as undefined (per S4), which is an honest engineering limitation: published removal percentages are matrix-specific, and pilot testing is non-negotiable for a 0.004 ppt target. Engineers writing a design basis in 2026 should treat any vendor removal curve as a starting point, not a guarantee.
Reactor Comparison: Fenton, Ozone, UV/H2O2, and UV/Sulfate for PFAS
No top-3 page for this query provides a side-by-side reactor comparison with energy intensity and CAPEX tier. The matrix below is the center of gravity of this article and the basis for an equipment spec.
| Reactor | Typical PFAS Removal Band | Energy Intensity (kWh/m³, order of magnitude) | CAPEX Tier (5–50 m³/h skid) | Main Limitation |
|---|---|---|---|---|
| Fenton / Fenton-like (Fe²⁺ + H₂O₂) | 50–80% on long-chain; poor on short-chain | 0.1–0.5 (low electrical, chemical-dominated) | Low ($150K–$400K) | Iron sludge handling; narrow pH window (2.5–3.5); F⁻ re-complexation |
| O₃ and O₃/H₂O₂ | 60–90% on PFOA/PFOS at pilot scale | 0.5–2 (ozone generator dominates) | Medium ($300K–$700K) | Bromate formation in bromide-bearing water; mass-transfer limited |
| UV/H₂O₂ | > 99.9% on 200 ppt → < 0.004 ppt (NJ 2025 case, per S2) | 1–4 (low-pressure UV lamps) | Medium-High ($400K–$900K) | •OH scavenging at high TOC; peroxide residual management |
| UV/Persulfate (UV/PS) | Often higher than UV/H₂O₂ on short-chain PFAS | 1–3 (UV + persulfate dose) | High ($500K–$1.2M) | Sulfate residual in effluent; reagent cost |
The New Jersey municipal plant cited in S2 hit 200 ppt influent to < 0.004 ppt effluent using a UV/H₂O₂ configuration in 2025, which is the strongest published full-scale benchmark for the technology at the EPA's 2025 MCL. The AFIT UV/H₂O₂ work on AFFF-impacted groundwater (per S4) is the second anchor: it shows the reactor works on real PFAS mixtures, not just spiked lab samples. Plasma and electrochemical AOP are emerging 2026 options with promising bench-scale data, but full-scale performance at 0.004 ppt is not yet published. For a defensible 2026 recommendation, UV/H₂O₂ remains the documented choice, with UV/persulfate as the leading alternative where short-chain PFAS dominate.
Pretreatment Is Not Optional: TOC, Foaming Agents, and AFFF Reality
Most PFAS systems quietly succeed or fail at the TOC step. The AFIT data on AFFF-impacted source water shows influent TOC rising from a baseline of ~3 mg/L to ~100 mg/L once surfactants dissolve into the matrix (per S4, Schmidt 2017). At 100 mg/L TOC, GAC adsorption sites are consumed by dissolved organics long before they see a PFAS molecule, which is the single most common reason a "GAC should have worked" system fails in the field. The AOP step is therefore not about polishing PFAS — it is about stripping the competing TOC so the polishing GAC can actually do its job.
The AFIT Rapid Small-Scale Column Test (RSSCT) data quantifies the gain. After UV/H₂O₂ pretreatment, GAC capacity for PFOS jumped 200% and 700% in two independent test conditions, with repeat PFOS runs at 1700% and 1800% (per S4). PFOA capacity rose 1000% in the same series. Those numbers are the strongest "AOP buys GAC life" figures in the public domain, and they translate into a hard design rule: target < 10 mg/L TOC post-AOP for effective GAC polishing on PFAS. AFFF surfactant foaming is a separate hydraulic issue — fire-training and military sites can see 0.5–1 m foam blankets in equalization basins — so a defoamer dose and a PLC-controlled chemical dosing skid are typically engineered into the head of the train, with multi-media filtration pretreatment upstream to protect the UV sleeves from surfactant carryover.
CAPEX, OPEX, and Sizing Logic for a 2026 AOP Skid
The 2026 installed-cost shape of an AOP system for PFAS wastewater, drawn as engineering class estimates rather than vendor quotes, is wide enough to anchor a budget conversation with procurement. A containerized 5–50 m³/h AOP skid typically lands in the $150K–$900K installed range depending on reactor choice and influent quality. A full AOP + GAC polishing train at the same flow scale is closer to $400K–$1.8M, with the polishing vessels and instrumentation driving the delta. For a detailed walkthrough of where these numbers flex, see the AOP advantages and disadvantages in 2026 engineering guide.
| Cost Driver | Dominant For | Typical Range / Behavior |
|---|---|---|
| H₂O₂ chemical cost | Fenton, UV/H₂O₂ | Often 40–60% of OPEX at high TOC |
| UV lamp replacement | UV/H₂O₂, UV/PS | Lamp life 8,000–12,000 h; budget ~$0.005–$0.02/m³ |
| Ozone generator power | O₃ and O₃/H₂O₂ | ~10–15 kWh per kg O₃ generated |
| Iron / catalyst replacement | Fenton | Sludge handling dominates downstream |
| GAC media replacement | Polishing step (all trains) | Every 6–18 months depending on TOC; $5K–$25K per vessel |
| PLC-controlled chemical dosing | All trains | Specify a PLC-controlled chemical dosing skid sized to peak H₂O₂ demand |
Sizing should be driven by log-removal target and verified •OH exposure (CT), not by volumetric flow alone. For a 4-log target (200 ppt → 0.02 ppt) with a UV/H₂O₂ reactor, designers typically benchmark 1–4 kWh/m³ and an H₂O₂ dose in the 50–500 mg/L range, then verify with on-site radical-exposure testing. The AFIT team explicitly listed life-cycle cost analysis as "future research" (per S4), so OPEX uncertainty is real and should be carried into the recommendation memo as a sensitivity range rather than a single point. For facility-specific mass-balance work, the AOP system process flow diagram guide is a useful starting point, and a multi-media filtration pretreatment step is almost always specified ahead of the UV bank to control lamp fouling.
Frequently Asked Questions
What is the EPA's 2025 MCL for PFOA and PFOS, and can AOP meet it?
The EPA's 2025 MCLs are 0.004 ppt for PFOA, 0.004 ppt for PFOS, and a Hazard Index of 1 for any mixture of PFNA, PFHxS, HFPO-DA (GenX), and PFBS (per S2). A 2025 New Jersey municipal UV/H₂O₂ system cut 200 ppt influent to below 0.004 ppt effluent (per S2), demonstrating that an AOP + polishing train is technically capable of meeting the limit at full scale.
How much does a 2026 AOP system for PFAS wastewater cost?
Engineering class estimates place a containerized 5–50 m³/h AOP skid at $150K–$900K installed, and a full AOP + GAC train at the same flow at $400K–$1.8M. OPEX is dominated by H₂O₂ chemical cost (40–60% of OPEX at high TOC) and GAC media replacement every 6–18 months.
Why is GAC alone not enough for PFAS removal at high TOC?
At ~100 mg/L influent TOC (typical of AFFF-impacted water per S4), dissolved organics outcompete PFAS for GAC adsorption sites and exhaust the carbon prematurely. AFIT RSSCT data shows UV/H₂O₂ pretreatment can boost PFOA GAC capacity by 1000% and PFOS capacity by 200%–1800% (per S4), which is why the AOP-then-GAC train is the dominant 2026 architecture.
Which AOP reactor works best for short-chain PFAS like PFPeA and PFHxA?
UV/persulfate (UV/PS) typically outperforms UV/H₂O₂ on short-chain PFAS because the sulfate radical (SO₄•⁻, E° = +2.5 to +3.1 V) is more selective for the C–F bond at near-neutral pH (per S4). UV/H₂O₂ remains the more documented 2026 choice for long-chain PFOA/PFOS at the 0.004 ppt MCL.
What is the minimum data I need to size a PFAS AOP reactor?
At minimum: influent PFAS speciation and concentration (per species), influent TOC, bromide, alkalinity, pH, and target log-removal tied to the EPA 2025 MCL of 0.004 ppt for PFOA/PFOS. The AFIT team explicitly flagged optimal H₂O₂ concentration and UV contact time for AFFF matrices as undefined (per S4), so on-site pilot testing is non-negotiable for a defensible 2026 design basis.