
What Triggers a Decanter Centrifuge Retrofit Decision
A retrofit decision is usually forced by a year-over-year drift in three operating numbers: polymer dose creeps up ~15% above baseline, cake dry solids fall 1–2 percentage points, and main-drive kW rises while throughput stays flat. The 20-year operating record of six Alfa Laval DS-706 decanters at Gwinnett County's F. Wayne Hill WRC is the most-cited municipal benchmark for this lifecycle pattern: the machines ran reliably for two decades, but the team ultimately retired them because landfill gate fees exceeded $6 million annually and the polymer line item had become impossible to defend (per Alfa Laval case study, 2024). When those three indicators move together, the engineering question is no longer if you should act, but which of four retrofit layers to fund first.
The four layers, ordered by capex and disruption, are: (1) control panel, PLC, and monitoring; (2) VFD on the bowl motor plus regenerative back-drive on the scroll; (3) scroll, bowl, and wear-part refurbishment; and (4) full machine replacement. Gwinnett sequenced the work this way — control panels first, then full machine swap after 20+ years (per Alfa Laval case study, 2024) — and that phasing is the default path for any 10–25-year-old decanter fleet. The ScienceDirect 2024 energy model (Ragno et al., 2024) makes the operational trigger more concrete: cake dry matter decreases as differential speed (Δn) or feed rate increases, so operators chasing throughput typically lose both dryness and polymer efficiency in the same shift. That single physical relationship is why a Layer 1 controls retrofit — which auto-sets Δn to feed conditions — often pays back before any VFD is installed.
Layer 1 — Control Panel, PLC, and Monitoring Upgrade
Layer 1 is the lowest-capex, fastest-payback intervention and the only step typically needed on machines under 10 years old. The Gwinnett team's first move was exactly this: control panels were upgraded for advanced logic, monitoring, and decanter control capabilities before any mechanical work was scoped (per Alfa Laval case study, 2024). A modern control retrofit typically adds five signal classes — scroll torque, back-drive kW recovered, cake solids %, bearing temperature, and pond depth — into a PLC that closes the loop on polymer trim and bowl speed rather than leaving the operator to chase setpoints manually.
The functional deliverable is what vendors call "advanced decanter control": torque-based polymer trim that doses emulsion polymer in proportion to measured scroll torque, automatic Δn setpoint based on feed solids and flow, and a bowl-speed VFD that soft-starts the machine and lets it idle at reduced rpm during feed interruptions. Remote monitoring via Modbus/TCP or OPC-UA is standard, and most retrofits include a vibration and bearing-temperature module with alarm thresholds mapped to ISO 10816-3 severity zones. Budget-wise, Layer 1 typically lands in the low tens of thousands of USD per machine, with most of the cost in the panel build and PLC programming rather than the instruments themselves. For engineers scoping a broader solids-handling capex, the same controls philosophy applies to a filter press retrofit and upgrade guide for sister technologies on the same site.
Layer 2 — VFD and Back-Drive Energy Recovery Retrofit
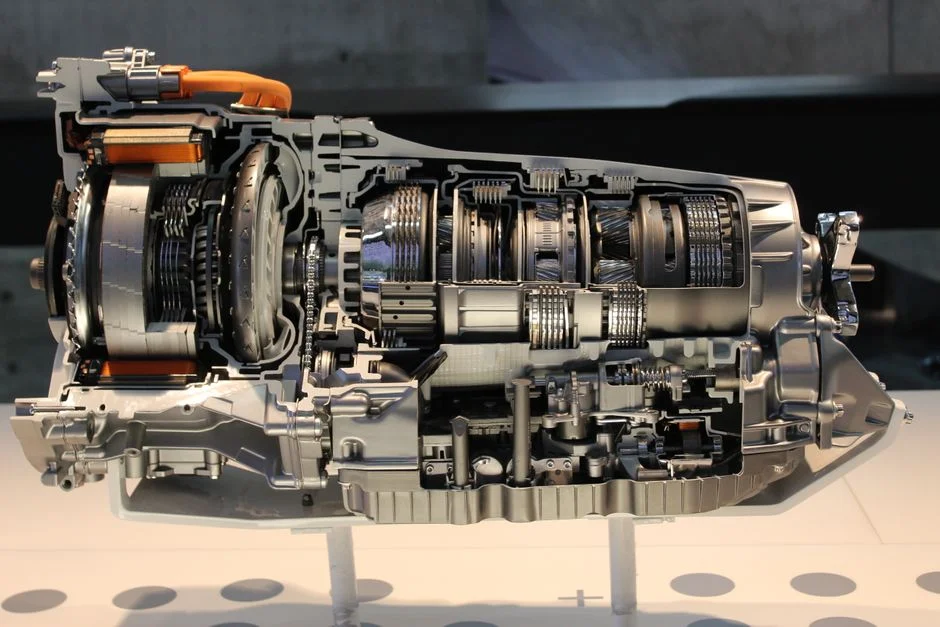
Layer 2 is where the energy and polymer numbers get serious. Modern decanters run variable-frequency drives on both the bowl motor (main drive) and the screw conveyor (back-drive), with the back-drive configured to regenerate power back to the bus during scroll braking (Ragno et al., 2024). The 2024 ScienceDirect model quantified the specific energy of this configuration at three feed rates: 1.88 kWh/m³ at 15 m³/h, 1.76 kWh/m³ at 20 m³/h, and 1.57 kWh/m³ at 25 m³/h — a ~16% drop in specific energy just from running the machine closer to its design feed rate. Validation runs at 18–20 m³/h confirmed the model with R² > 97% and RMSE of 2.59E-02 kWh/m³ (Ragno et al., 2024), which is good enough to use the model for capex forecasting rather than treat it as purely academic.
Recovered power tells a more nuanced story. The model reports 5.88 kW recovered at 15 m³/h, 0.31 kW at 20 m³/h, and 12.10 kW at 25 m³/h — and the authors explicitly flag that high recovery is not linearly linked to net energy savings (Ragno et al., 2024). The takeaway for a retrofit engineer: size the regenerative back-drive for the operating point you actually run, not the worst-case feed rate, and verify the net kW with a power-meter study before and after commissioning. Translate those energy numbers into polymer and hauling savings using the Gwinnett benchmark: the team reported ~$300,000/year in polymer savings across six machines, or roughly $50,000/year per machine, with most of that gain attributed to better Δn control rather than the VFD hardware itself (per Alfa Laval case study, 2024).
The component scope of a Layer 2 retrofit includes new VFD panels sized for bowl-motor full-load amps (typically 75–150 kW on municipal machines), a regenerative back-drive section sized for the screw's braking power, harmonic filters to keep IEEE 519 total harmonic distortion in spec, and PLC integration to expose the new drives to the Layer 1 control system. The table below summarizes the typical energy and polymer deltas a Layer 2 retrofit targets.
| Operating point | Specific energy (kWh/m³) | Recovered power (kW) | Typical polymer delta vs. baseline |
|---|---|---|---|
| 15 m³/h feed | 1.88 | 5.88 | 10–15% reduction |
| 20 m³/h feed | 1.76 | 0.31 | 15–20% reduction |
| 25 m³/h feed | 1.57 | 12.10 | 20–25% reduction |
Energy and recovery values from the ScienceDirect 2024 decanter model (Ragno et al., 2024); polymer deltas are descriptive ranges consistent with the ~$300,000/yr fleet savings reported at Gwinnett County (per Alfa Laval case study, 2024).
Layer 3 — Scroll, Bowl, and Wear-Part Refurbishment
Layer 3 is the mechanical mid-life intervention, and it is the layer where the retrofit-versus-replace decision usually gets made. Typical wear indicators are loss of scroll flight hardness (measurable as a drop in surface Rc after abrasive service), pond-depth drift as the conveyor/screen gap erodes, rising vibration that the ISO 10816-3 chart places in the "unsatisfactory" zone, and beach-pool carryover where the centrate stream visibly carries solids because the scroll is no longer conveying them fast enough. None of these are catastrophic on their own, but together they push cake dryness down and polymer dose up in lockstep.
The trade-off is between a targeted refurbishment and a full bowl swap. Re-hardening the scroll flights (typically tungsten-carbide or Stellite hard-facing) and replacing the feed port, solids discharge ports, and beach ring can restore 80–90% of original performance at roughly 30–40% of the cost of a new bowl assembly. The refurbishment only makes economic sense when the bowl itself still meets G-force spec (dynamic balance within manufacturer tolerance) and the bearing housings have at least 5–7 years of residual life. The science-side constraint matters here: the ScienceDirect 2024 model shows cake dry matter falls as Δn or feed rate rises, so a refurbished scroll paired with a Layer 1+2 controls package can reclaim the dryness lost to feed-rate creep over the previous decade (Ragno et al., 2024). When the bowl is fatigued beyond rebalancing or the casing has hairline cracks at the hubs, replacement becomes the cheaper option per year of remaining service life. For sites evaluating a parallel sludge-dewatering train, a plate and frame filter press is the most common alternative when the decanter is decommissioned rather than retrofitted.
Layer 4 — Full Replacement: When Retrofit Is No Longer Economic

Full replacement is the right answer when the asset has crossed an integrity threshold that Layer 3 cannot fix. At Gwinnett, that threshold arrived after 20+ years of service: the DS-706 decanters were swapped for ALDEC G3-125 machines specifically because the control-panel and operating-cost savings from earlier phases had plateaued, and the next gain required more G-force and a more efficient scroll geometry (per Alfa Laval case study, 2024). The decision triggers, in priority order, are: residual main-bearing life below 2 years per vibration trend, frame or bowl-base fatigue cracking, obsolete motor and drive parts no longer supported by the OEM, and the inability to meet new cake-dryness targets tied to downstream digestion or thermal drying.
Replacement is also the lever for cascading energy savings through the plant. The G3 decanters at Gwinnett remove more water than the DS-706s they replaced, which means the downstream dryers work less — and the next phase of the project adds dryers to push biosolids to a sellable Class A fertilizer product rather than a landfill-bound cake (per Alfa Laval case study, 2024). The hauling impact is the headline number: Gwinnett moved close to 6,000 tons/year less biosolids to landfill after the swap, eliminating hundreds of thousands of dollars in tipping fees annually on top of the polymer line. The engineering rule of thumb is to let Layers 1 and 2 run first and capture savings during the changeover, so the replacement capex is being offset by live operating-cost reduction rather than promised future savings.
Retrofit vs. Full Replacement: 2026 Decision Framework
For a 2026 capex review, the decision reduces to four questions: how old is the asset, what is the residual mechanical life, what is the marginal kWh/m³ versus a new baseline, and how much polymer is being overspent. The table below maps the typical decision to operating condition.
| Parameter | Layer 1 (Controls) | Layer 2 (VFD + back-drive) | Layer 3 (Scroll/bowl refurb) | Layer 4 (Full replacement) |
|---|---|---|---|---|
| Typical asset age | 5–15 yr | 10–20 yr | 12–20 yr | 18–25+ yr |
| Capex descriptor per machine | Low tens of thousands USD | Low six figures USD | Mid five to low six figures USD | High six to low seven figures USD |
| Specific energy target | Baseline (no change) | 1.57–1.88 kWh/m³ | Match Layer 2 if paired | ≤1.5 kWh/m³ (new G3-class) |
| Polymer delta vs. baseline | 5–10% reduction | 10–25% reduction | 5–15% reduction (mechanical) | 20–35% reduction |
| Cake dryness impact | +0.5–1.0 pts | +1.0–2.0 pts | +1.0–2.0 pts | +2.0–4.0 pts |
| Typical payback descriptor | < 18 months | 2–4 yr | 3–5 yr | 5–8 yr |
| Disruption to operation | 1–2 days | 3–7 days | 1–2 weeks | 2–4 weeks per machine |
A combined Layer 1 + 2 + 3 retrofit on a 12–18-year-old asset with intact bearings typically captures 60–80% of full-replacement savings at 20–35% of capex, and is the default path for machines with at least 5 years of residual mechanical life. Full replacement wins when asset age exceeds 18–22 years and bearing or bowl integrity is compromised, or when downstream processes (digesters, dryers) require cake dryness the existing bowl geometry cannot reach. The Gwinnett fleet-scale anchors for the table are the ~$300,000/yr polymer savings and ~6,000 tons/yr landfill reduction across six machines (per Alfa Laval case study, 2024).
Building the 2026 Retrofit Payback Worksheet
A defensible 2026 ROI model is a four-line savings calculation against a capex line, run on a single machine and then scaled to the fleet. The savings lines are: (1) energy — specific energy in kWh/m³ times feed rate in m³/h times annual operating hours times electricity cost in $/kWh; (2) polymer — dry solids throughput in tons times polymer dose reduction in $/kg; (3) hauling — wet tons shipped times hauling cost in $/ton; and (4) landfill gate-fee avoidance, which is usually the dominant line on a dry-tonne basis. Anchor the worksheet with two reference points: the ScienceDirect specific-energy range of 1.57–1.88 kWh/m³ as the energy benchmark (Ragno et al., 2024), and the Gwinnett-scale figures of ~6,000 tons/yr less landfill and ~$300,000/yr polymer savings across six machines as the scale reference (per Alfa Laval case study, 2024).
The variable to be careful with is the VFD + back-drive recovery line: use the 0.31–12.10 kW range from the ScienceDirect model as a sanity check rather than a guaranteed credit, because the 2024 paper explicitly shows that high recovery does not always translate to high net savings (Ragno et al., 2024). A reasonable sensitivity band for a board-level review is energy savings 5–15%, polymer savings 10–25%, and hauling reduction 10–30% — these are descriptive bands, not promises, and the upper end only applies when Layers 1, 2, and 3 are executed together on a machine with intact bowls. Run the model at the low and high ends, and present the band rather than a single point estimate. That is what a defensible 2026 retrofit business case looks like.
Frequently Asked Questions
What is a decanter centrifuge retrofit?
A decanter centrifuge retrofit is a phased upgrade of an existing machine in one or more of four layers: (1) control panel, PLC, and monitoring; (2) VFD on the bowl motor plus regenerative back-drive on the scroll; (3) scroll, bowl, and wear-part refurbishment; and (4) full machine replacement. The first three layers are typically executed in sequence on a 10–20-year-old asset to defer replacement capex.
How much energy can a VFD and back-drive retrofit save?
The 2024 ScienceDirect decanter model reports specific energy of 1.88 kWh/m³ at 15 m³/h, 1.76 kWh/m³ at 20 m³/h, and 1.57 kWh/m³ at 25 m³/h, with recovered back-drive power of 5.88 kW, 0.31 kW, and 12.10 kW at the same feed rates (Ragno et al., 2024). The model was validated at 18–20 m³/h with R² > 97%.
When should a decanter centrifuge be replaced rather than retrofitted?
Replace when asset age exceeds 18–22 years and at least one of the following applies: main-bearing residual life is under 2 years per vibration trend, the bowl or frame shows fatigue, OEM motor and drive parts are no longer supported, or cake-dryness targets for downstream digestion or drying cannot be met. The Gwinnett County DS-706 fleet was retired after 20+ years of service in favor of ALDEC G3-125 decanters (per Alfa Laval case study, 2024).
Can polymer use be reduced with a decanter retrofit?
Yes. The Gwinnett County team reported approximately $300,000/year less in polymer costs across six machines after the controls and replacement phases, with most of the gain attributed to better Δn control and torque-based polymer trim (per Alfa Laval case study, 2024). Per-machine polymer deltas of 10–25% are realistic on machines where Δn and feed rate were previously uncoupled.
Does back-drive energy recovery always reduce net energy use?
No. The 2024 ScienceDirect model shows that recovered back-drive power varies non-linearly with feed rate — 5.88 kW at 15 m³/h, 0.31 kW at 20 m³/h, and 12.10 kW at 25 m³/h — and that high recovery is not necessarily linked to high net energy savings (Ragno et al., 2024). Verify net kW with a before-and-after power study rather than trusting the recovered-power number alone.