

Why Hydrostatic Test Water Is a Unique ZLD Feed
Sizing a ZLD system for hydrostatic test water starts with quantifying the batch volume (typically 50–5,000 m³ per test event), test frequency (1–12 events/year), and feed chemistry (TDS <500 mg/L, trace oxygen scavenger, mild inhibitor). Pair a membrane pre-concentration stage (90–95% recovery per MDPI 2025) with a thermal crystallizer sized at ~0.30 kg steam per kg water evaporated, plus sludge dewatering for metal-oxide solids. This delivers a closed-loop, zero-discharge train sized to the site's worst-case test event.
Hydrostatic test water is the discharge from pressure-leak testing of vessels, piping, and heat exchangers. Source water is usually potable, demineralized, or condensate — dosed with an oxygen scavenger (hydrazine or sodium sulfite at 50–200 mg/L) and a nitrite-borate or amine-film corrosion inhibitor (typically 100–500 mg/L). Because the water is held only briefly in a clean steel system, the dissolved load is small, but the suspended load is meaningful: rust and mill scale shed during the drain cycle routinely produce 20–200 mg/L TSS of iron and manganese oxides.
The hydraulic profile breaks conventional WWTP design. A single large pressure-vessel or pipeline test can release 50–5,000 m³ in a 4–48 hour drain window, and a typical facility runs 1–12 such events per year. That gives peak instantaneous flows of 50–200 m³/h on a stream that is otherwise zero for weeks at a time. Equalization, not treatment capacity, governs the design. The chemistry also reframes the problem: with TDS typically below 500 mg/L, this is not a high-strength brine job — it is a peak hydraulic capture problem with a strong closed-loop reuse case, because the same water can be regenerated as test make-up.
Feed Characterization Worksheet Before You Size Anything
Before any equipment is specified, lock down the feed envelope. Per test event, capture total discharge volume, fill and drain flow rates in m³/h, the test pressure class (which sets the inhibitor dose), the source-water analysis, and the SDS for every dosing chemical. Sample at the drain header for TSS, TDS, conductivity, pH, temperature, Fe, Mn, oil & grease, COD, and inhibitor-specific species (nitrite, borate, hydrazine, amine). Document the test calendar — bundling four vessel tests into a single weekend shifts CAPEX from permanent ZLD capacity to temporary surge storage.
Even low-TDS feeds can scale evaporators once cycled up. Run a Langelier Saturation Index (LSI) or Ryznar Stability Index (RSI) on the blend of source water plus inhibitor residuals; an LSI above +0.5 at the membrane concentrate temperature is a red flag for CaCO₃ deposition on the evaporator tubes. For reference, the table below lists the parameters that drive downstream sizing decisions.
| Parameter | Typical Range | Design Implication |
|---|---|---|
| Batch volume | 50–5,000 m³/event | Equalization basin size |
| Drain flow rate | 25–200 m³/h | Pump and pretreatment hydraulics |
| TDS (feed) | <500 mg/L | RO recovery ceiling, salt mass |
| TSS (feed) | 20–200 mg/L | Clarifier/DAF sizing, filter press duty |
| LSI at concentrate | −0.5 to +1.2 | Antiscalant dose 2–5 mg/L |
| Oil & grease | <10 mg/L (usually) | DAF upstream of membranes |
| Event frequency | 1–12/year | Operating hours, OPEX scaling |
For background on the RO recovery and energy fundamentals that drive Step 2 below, the 2025 MDPI review by Panagopoulos and Michailidis is the most current single reference.
The 2026 ZLD Train Configuration for Hydrostatic Test Water
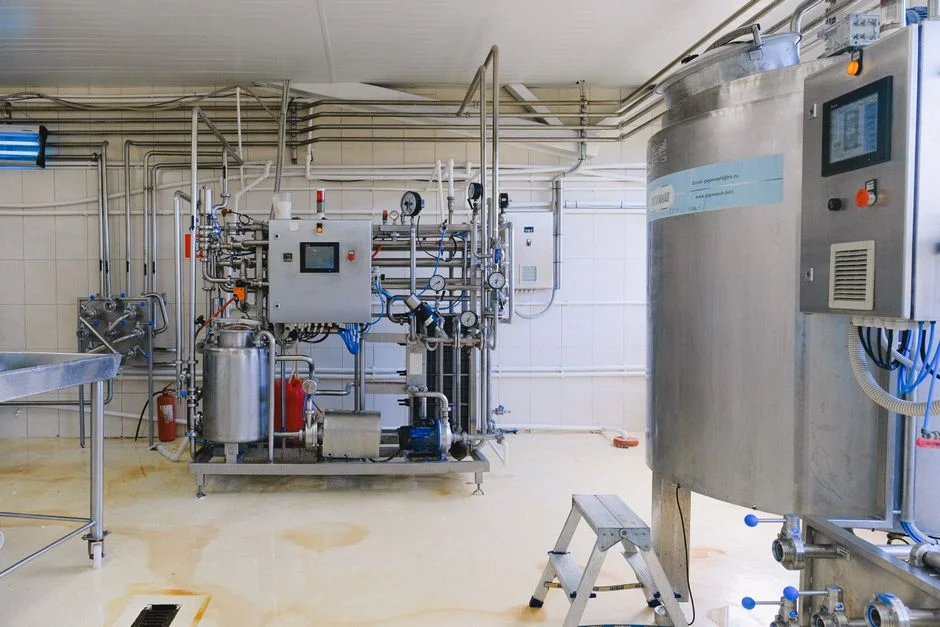
The unit-operation stack for this duty has matured into a six-stage train. Equalization comes first: a concrete or geomembrane-lined basin sized for the largest single test event with a 1.25× safety factor (so a 1,000 m³ test needs at least 1,250 m³ of usable storage). From equalization the stream flows to a DAF system for oil and oxide removal or a lamella clarifier — whichever matches the TSS and oil profile — followed by a multi-media filter to polish to <5 mg/L TSS before the membranes. Panagopoulos and Michailidis (MDPI, 2025-02) emphasize that robust pretreatment is the single largest determinant of membrane lifetime in ZLD service.
The membrane stage is the workhorse. An industrial RO system (or nanofiltration on borderline cases where divalent hardness dominates) pre-concentrates the RO reject to 50,000–70,000 mg/L TDS at 90–95% recovery, cutting the thermal load by an order of magnitude. The RO permeate already meets most hydrostatic-test conductivity targets, so a slipstream of permeate can return directly to the test header. The reject then feeds a mechanical vapor recompression (MVR) or multi-effect evaporator followed by an agitated crystallizer for final water/salt separation. A plate-and-frame filter press handles the metal-oxide sludge from the clarifier and the salt cake from the crystallizer, producing an 8–12% dry-solids cake. Condensate polishing (mixed-bed ion exchange or a small polishing RO) returns near-deionized water to the test header, closing the loop per the reduce-reuse-recycle framework documented in Mohan (STAI, 2024-07). For sites that already have sedimentation capacity, a high-efficiency sedimentation tank can replace the lamella stage.
Step-by-Step Sizing Calculations
Use a worst-case single event as the basis. The worked numbers below assume an 800 m³ vessel test drained over 16 hours — a realistic duty for a mid-size pressure vessel or a 20 km pipeline segment.
Step 1 — Peak hourly flow Q. Q = 800 m³ ÷ 16 h = 50 m³/h. Equalization, transfer pumps, and pretreatment are all sized on Q. The 1.25× safety factor pushes the basin to 1,000 m³ working volume.
Step 2 — Membrane area. RO flux for brackish-grade elements on this feed runs 15–20 L/m²·h at 90–95% recovery. Permeate flow = 50 m³/h × 0.92 ≈ 45 m³/h. Required membrane area A = 45,000 L/h ÷ 17.5 L/m²·h (mid-range) ≈ 2,570 m², which rounds to 2,250–3,000 m² once element pressure and temperature corrections are applied. That is roughly 8–10 industrial 8-inch elements per m³/h of permeate.
Step 3 — Evaporator duty. Residual water after RO = Q × (1 − recovery) = 50 × 0.08 = 5 m³/h entering the MVR. Specific steam consumption of 0.25–0.35 kg steam per kg water evaporated (HydropureWater field data, 2026) gives 1,250–1,750 kg/h steam equivalent — about 0.7–1.0 MWe of compressor power for an MVR unit.
Step 4 — Crystallizer salt capacity. Assume 99% salt rejection in the RO. With source water at 200 mg/L NaCl-equivalent and a 20× concentration factor across the membrane, the reject carries ~4,000 mg/L. Over an 800 m³ event that produces 800 m³ × 0.08 × 4,000 mg/L ≈ 256 kg NaCl-equivalent as dissolved salt to the crystallizer, plus a small fraction of inhibitor-bound nitrogen species. For comparison, a much higher-TDS feed (2,000 mg/L × 20×) would yield ~3.2 t salt per event — orders of magnitude above the hydrostatic-test baseline and the reason this stream is so amenable to closed-loop reuse.
Step 5 — Sludge dewatering. Solids captured upstream run 1–2% dry solids from the DAF/clarifier underflow. A filter press targeting 8–12% cake handles the duty in 2–4 hour cycle times; plate count is driven by event frequency rather than batch size for this feed.
| Step | Calculation | Result |
|---|---|---|
| 1. Peak flow Q | 800 m³ ÷ 16 h | 50 m³/h |
| 2. RO membrane area | 45 m³/h permeate ÷ 17.5 L/m²·h | ~2,570 m² |
| 3. Evaporator duty | 5 m³/h × 0.30 kg/kg | 1,250–1,750 kg/h steam |
| 4. Salt mass (200 mg/L feed) | 800 × 0.08 × 4,000 mg/L | ~0.26 t/event |
| 5. Filter press feed | 1–2% DS, target 8–12% cake | 2–4 h cycle |
CAPEX and OPEX Comparison: Membrane-Thermal vs Thermal-Only
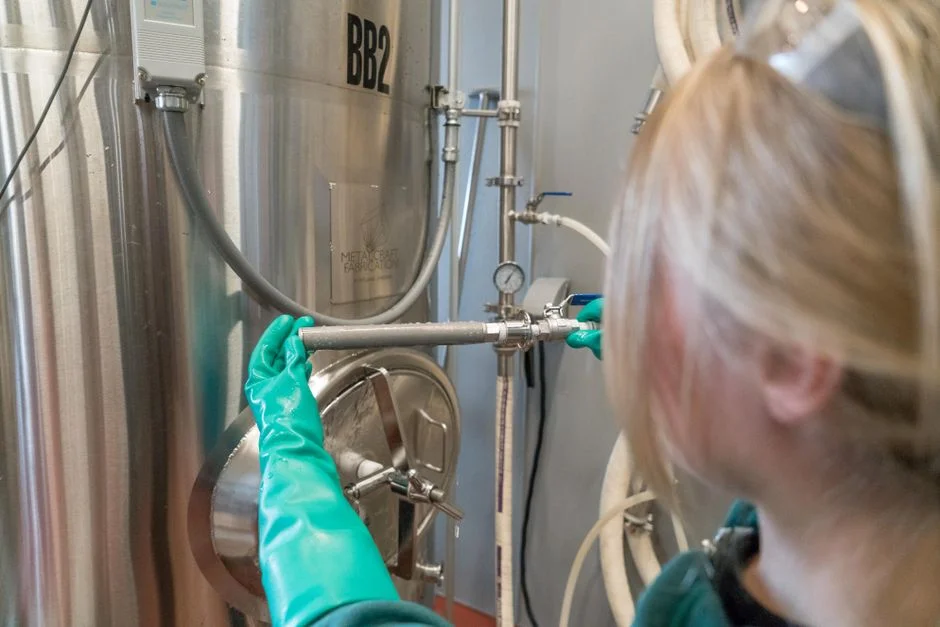
Two configurations dominate procurement evaluations for this duty. A membrane-thermal hybrid uses RO to cut thermal load, with an MVR/crystallizer on the RO reject. A thermal-only train sends the equalized feed directly to an MVR followed by a crystallizer, with no membrane stage. The hybrid wins on thermal energy and steady-state OPEX; the thermal-only option wins on simplicity, membrane-free operation, and tolerance for inhibitor chemistry that would foul polyamide elements.
Indicative 2026 CAPEX for a 50 m³/h design basis: membrane-thermal hybrid USD 1.5–3.0 million, thermal-only USD 2.5–4.5 million. OPEX for the hybrid runs 60–70% lower on steam but carries membrane replacement every 3–5 years (typical element life in ZLD reject service) and a 2–5 mg/L antiscalant dose. The delta narrows as test frequency rises above 6 events/year because the hybrid's lower per-m³ energy cost compounds. Closed-loop condensate reuse typically pays back the membrane stage within 2–4 years for sites running more than four events per year. Adhering to a structured RO membrane maintenance protocol is what protects that payback.
| Parameter | Membrane-Thermal Hybrid | Thermal-Only (MVR + Crystallizer) |
|---|---|---|
| CAPEX (50 m³/h, 2026) | USD 1.5–3.0 M | USD 2.5–4.5 M |
| Steam equivalent | 1,250–1,750 kg/h | 5,000+ kg/h |
| Electrical load | High (RO HP pumps + MVR) | Moderate (MVR only) |
| Membrane replacement | Every 3–5 years | None |
| OPEX driver ranking | Thermal > membranes > antiscalant > labor | Thermal > labor > power |
| Best fit | ≥4 events/year, low-TDS, >95% reuse target | <4 events/year, fouling-prone chemistry |
Design Pitfalls and Compliance Notes
Four failure modes recur on this duty. First, under-sized equalization: always size to the single largest test plus 25% margin, because the drain rarely arrives as a flat rate — it spikes when vessels are cracked. Second, inhibitor incompatibility: some amine-film inhibitors foam aggressively in MVR evaporators, carrying over with the condensate and fouling the polishing bed. Specify low-foam inhibitors or dose antifoam upstream of the MVR. Third, CIP routing: RO clean-in-place chemicals are high-pH/high-TDS and must go to the evaporator, not back to the equalization basin, or they defeat the closed loop. Fourth, regulatory drift: many jurisdictions now restrict total dissolved solids in any indirect discharge, which is the actual driver pushing this stream toward true ZLD rather than conventional clarification. For sites with other oily streams in parallel, the engineering trade-offs documented in this ZLD sizing for oily industrial streams reference share several pretreatment and evaporator-foaming pitfalls.
Frequently Asked Questions
What is the typical batch volume for a hydrostatic test discharge?
Single test events range from 50 m³ for a small pressure vessel to 5,000 m³ for a major pipeline or large reactor hydrotest. An 800 m³ event over 16 hours (≈50 m³/h peak) is a representative mid-range design basis for a refinery or LNG plant.
Why use ZLD for hydrostatic test water instead of conventional treatment and discharge?
Conventional biological or chemical-physical treatment is over-specified for a low-TDS batch stream and under-specified for the peak hydraulic load. Closed-loop ZLD regenerates the water as test make-up, eliminates the discharge permit, and — per Mohan (STAI, 2024-07) — aligns with the reduce-reuse-recycle hierarchy that regulators now expect for episodic industrial waste streams.
How much steam does an MVR crystallizer need for a 50 m³/h hydrostatic-test ZLD train?
With RO pre-concentration at 90–95% recovery, the MVR sees roughly 5 m³/h of feed. Specific steam consumption of 0.25–0.35 kg steam per kg water evaporated translates to 1,250–1,750 kg/h of steam equivalent, or 0.7–1.0 MWe of compressor power for an MVR-driven unit (HydropureWater field data, 2026).
Can RO handle the corrosion inhibitors in hydrostatic test water?
Standard polyamide RO elements tolerate most nitrite-borate and oxygen-scavenger residuals at typical 100–500 mg/L inhibitor doses, but amine-film inhibitors can foul elements and foam in the downstream MVR. Always run a 72-hour pilot on the actual inhibitor package before committing to a membrane-thermal hybrid, and route RO CIP reject to the evaporator rather than the equalization basin.
Related Equipment
- multi-media filter — specifications, capacity range, and technical data