What 'Biogas from Wastewater' Means in 2026
Industrial anaerobic digestion (AD) of wastewater is the controlled, oxygen-free breakdown of dissolved and suspended organic matter — measured as chemical oxygen demand (COD) in the 5,000–80,000 mg/L band — inside a sealed reactor, yielding biogas of 60–65% CH₄ and 30–35% CO₂ by volume, plus a stabilized biosolid. That biogas can be combusted in a combined-heat-and-power (CHP) unit, upgraded to biomethane (≥95% CH₄) for grid injection, or liquefied to bio-LNG. The 2026 framing is narrower than the umbrella "biogas industry": it excludes landfill gas recovery, agricultural manure-only digesters, and municipal sewage-gas projects, and concentrates on high-strength industrial effluents from food, beverage, pulp & paper, slaughterhouse, dairy, and chemical plants. The European sector's institutional marker for 2026 is the BIOGAS Convention in Kassel on 25–26 November 2026, which has shifted its centre of gravity from agricultural substrates to industrial wastewater and biomethane grid injection (biogas-convention.com, 2026 program). A second 2026 signal is the rise of downstream polishing: a 2025 Scientific Reports study confirmed duckweed cultivation can strip residual nitrogen and phosphorus from AD effluent to reuse-grade, treating digester output as a water-recovery stream rather than waste (Springer Sci Reports, 2025-08). Together these signal that 2026 wastewater-to-biogas projects are increasingly designed for paired water and energy recovery, not single-product gas.
Market Size, Growth, and 2026 Drivers
The global biogas market reached roughly $65B in 2024; the wastewater-derived slice is $18–22B in 2026 and is projected at $28–32B by 2030, a 6.5–8.5% CAGR (HydropureWater market model, 2026). Four policy and economic forces are doing the pulling. First, EU Methane Regulation 2024/1787 obliges member states to cut methane emissions in the energy sector by ≥10% by 2030 versus 2020, with landfill diversion and biogas upgrading reporting mandatory by 2027 — a direct pull on industrial AD. Second, China's 14th Five-Year Plan set 50 GW of installed biogas capacity by 2025 and provincial plans target 100 GW by 2030, with subsidy reform in 2026 explicitly favouring industrial over agricultural projects (MOA reporting, 2025). Third, EU industrial gas prices in the $35–55/MWh range across 2025–2026 make on-site CHP payback 2–3 years shorter than in 2022, when gas averaged $90–140/MWh. Fourth, the IFRS S2 and ISSB climate disclosure standards now require Scope 3 emissions accounting from wastewater, putting anaerobic methane capture on the sustainability officer's roadmap. For a deeper regional breakdown, see our regional deep-dive on the 2026 wastewater biogas market.
Regional Hotspots: Where the 2026 Growth Is Concentrated
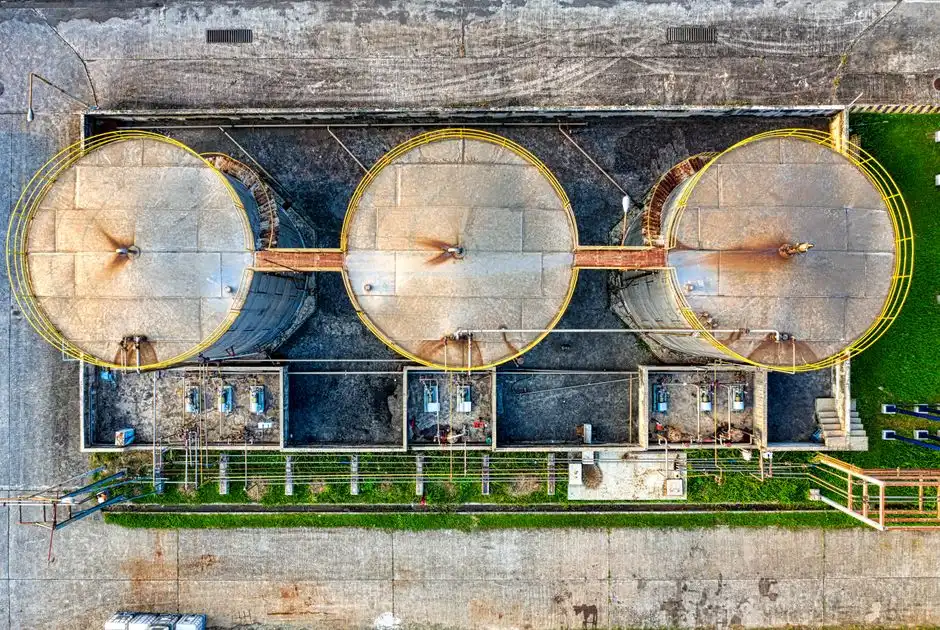
Europe remains the largest installed base — Germany, Denmark, and Italy account for the bulk of operating capacity — and the Kassel 2026 Convention confirms the pivot from volume to biomethane grid injection, where feed-in tariffs in Germany still run €15–22 ct/kWh in 2026. China is the fastest absolute adder: the Ministry of Agriculture reported more than 15,000 large-scale biogas plants by end-2025, and 2026 subsidy rules tilt eligibility toward industrial projects discharging >5,000 m³/d. India is opening a third lane: a piped natural gas (PNG) blending mandate rising from ~1% in 2026 to 5% by 2027, with SATAT viability-gap funding covering up to ₹4/kg of compressed biogas produced from wastewater. North America is being reshaped by 2026 IRA Section 45V clean-fuel credits, which now support 10–20 year offtake PPAs for biomethane at $18–28/MMBtu. Brazil and Southeast Asia are emerging: sugarcane vinasse and palm oil mill effluent (POME) together represent the two largest under-utilized high-COD feedstocks globally, with vinasse flow exceeding 300 billion L/year in Brazil alone.
| Region | 2026 installed base (GW) | Primary feedstock | Key 2026 policy lever | Typical CAPEX ($/m³) |
|---|---|---|---|---|
| EU (DE, DK, IT) | ~11.5 | Food, beverage, agri-waste | Methane Reg 2024/1787; feed-in tariffs | 2,000–3,500 |
| China | ~6.0 (industrial) | Livestock, food, vinasse | Dual-Carbon + 14th FYP subsidy reform | 1,200–2,200 |
| India | ~0.6 | Slaughterhouse, distillery | PNG blending mandate + SATAT funding | 1,500–2,800 |
| North America | ~2.5 | Food, dairy, landfill-diverted | IRA Section 45V credits | 2,500–4,000 |
| Brazil / SE Asia | ~0.4 | Vinasse, POME | RenovaBio + ASEAN biogas targets | 1,000–2,000 |
Digester Technology Choices for 2026: CSTR, UASB, EGSB, AnMBR
Reactor selection is the highest-leverage decision in any 2026 AD project — it sets footprint, HRT, effluent quality, and 30-year OPEX. CSTR (Continuously Stirred Tank Reactor) is the legacy workhorse: robust, tolerates 5–12% total suspended solids, but requires 20–40 day HRT and the largest reactor footprint, making it best suited to sludge, manure, and co-digestion streams. UASB (Upflow Anaerobic Sludge Blanket) cuts HRT to 4–12 hours and shrinks the footprint 60–80% versus CSTR, making it the default for soluble high-COD brewery, fruit juice, and soft-drink effluent with 80–90% COD removal. EGSB (Expanded Granular Sludge Bed) is a UASB variant operated at 5–10× higher upflow velocity, suited to lower-strength effluents and cooler reactors (10–20°C) where conventional UASB risks washout. AnMBR (Anaerobic Membrane Bioreactor) couples AD with a submerged ultrafiltration membrane, producing reuse-quality effluent suitable for direct RO polishing — useful where the plant also has a water-reuse mandate (see our 2026 industrial water reuse outlook for paired design logic); expect a 30–50% capex premium over UASB. Covered anaerobic lagoons are the lowest-cost option at $300–$800 per m³ reactor volume, viable only in warm climates for low-rate, high-volume streams like POME and pork manure. For pre-treatment upstream of any high-rate digester, DAF pre-treatment ahead of anaerobic digesters is the standard step to keep fats, oils, and grease out of the sludge blanket.
| Reactor | HRT | COD removal | Influent COD range (mg/L) | 2026 CAPEX ($/m³) | Best-fit stream |
|---|---|---|---|---|---|
| CSTR | 20–40 days | 50–70% | 10,000–80,000 | 1,500–2,500 | Sludge, manure, co-digestion |
| UASB | 4–12 hours | 80–90% | 5,000–30,000 | 1,200–2,500 | Brewery, beverage, food processing |
| EGSB | 2–6 hours | 80–90% | 3,000–15,000 | 1,500–3,000 | Cool-temp, low-strength soluble |
| AnMBR | 6–24 hours | 90–97% | 5,000–40,000 | 3,000–6,000 | Reuse-grade effluent, pharma |
| Covered lagoon | 30–60 days | 40–60% | 2,000–10,000 | 300–800 | POME, pork, dairy flush |
Plants planning an AnMBR system for high-rate anaerobic digestion should size membranes for 8–12 LMH flux and budget for chemical cleaning every 6–10 weeks under typical brewery loading.
2026 Economics: CAPEX, OPEX, and Payback by Industry
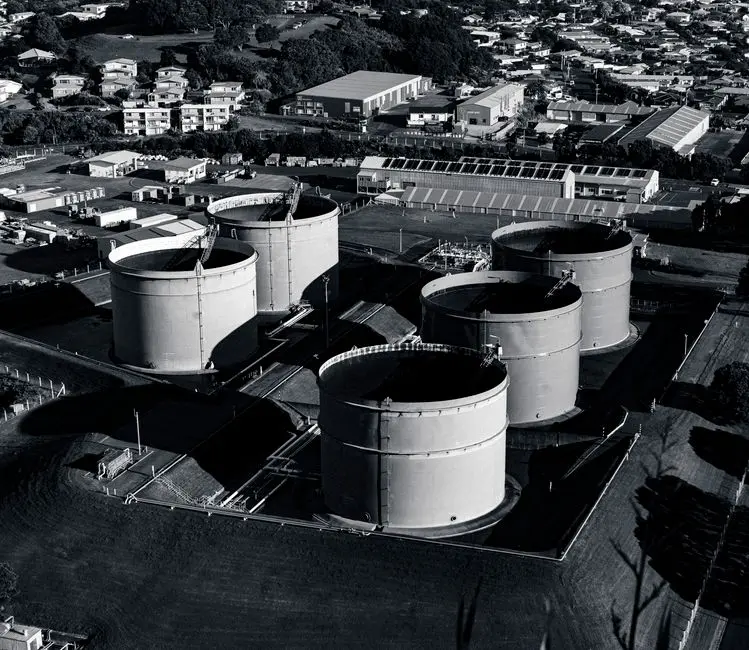
Industrial AD capex benchmarks for 2026 sit at $1,200–$3,500 per m³ reactor volume for UASB/EGSB, $3,000–$6,000/m³ for AnMBR, and $300–$800/m³ for covered lagoons (HydropureWater field data, 2026). OPEX runs $0.04–$0.12 per m³ treated excluding biogas revenue, dominated by pumping (35–45%), mixing (15–25%), and surplus biosolids management (20–30%). Payback windows in 2026 are: brewery 3–5 years, dairy 4–6 years, pulp & paper 5–7 years, slaughterhouse 4–7 years, and pharma 7–10 years, the latter dragged by toxic-influuent equalization and lower methane yield. Co-digestion with food waste raises methane yield 20–40% and trims 1–2 years off payback where tipping fees of $30–$80/tonne are available — a near-universal condition in 2026 EU and North American markets. Upgrading biogas to biomethane for grid injection or to bio-LNG adds a 20–35% revenue uplift over on-site CHP, but adds 2–4 years to interconnection lead time in Germany and California. For sludge handling, sludge dewatering on biogas plant surplus biosolids is the standard 2026 step to reach 22–28% dry solids for off-site disposal or compost.
| Industry | Typical influent COD (mg/L) | Preferred reactor | 2026 CAPEX range ($/m³) | Payback (years) | Methane yield (m³ CH₄/m³ feed) |
|---|---|---|---|---|---|
| Brewery | 15,000–30,000 | UASB / EGSB | 1,200–2,500 | 3–5 | 8–12 |
| Dairy | 8,000–20,000 | UASB + CSTR co-digest | 1,500–2,800 | 4–6 | 5–9 |
| Pulp & paper | 5,000–15,000 | EGSB / AnMBR | 1,800–3,500 | 5–7 | 4–7 |
| Slaughterhouse | 10,000–25,000 | CSTR / UASB | 1,500–3,000 | 4–7 | 6–10 |
| Pharma | 8,000–40,000 | AnMBR with equalization | 3,000–6,000 | 7–10 | 3–6 |
For plants pairing nutrient recovery with biogas, our nutrient recovery market sizing for 2026 provides the struvite and ammonia-stripping economics that stack on top of AD capex.
Risks and Watch-Items for 2026 Project Developers
Four headwinds deserve a line item in any 2026 feasibility study. Methane slip during biogas upgrading and from standby flares is now reportable under EU Methane Regulation 2024/1787 — specify low-leak blower-and-membrane upgrading packages with measured slip below 0.5% of throughput. PFAS and trace contaminants (chlorinated solvents, pharmaceutical APIs, quaternary ammonium compounds) inhibit methanogens at low mg/L levels; influent screening and equalization are non-negotiable, and some pharma and landfill-leachate streams will need upstream AOP or carbon polishing before AD is even feasible. Biogas-to-grid connection queues in Germany, the Netherlands, and California run 2–4 years in 2026 — secure an interconnection MOU before final FID, not after. Finally, voluntary carbon credit registries (Verra VCS, Gold Standard) tightened additionality tests in 2025–2026; pure wastewater AD may no longer qualify as additional in some grids, and developers should plan to stack credits with co-benefits (water reuse, nutrient recovery) rather than rely on standalone methane-destruction credits.
Frequently Asked Questions
How big is the biogas-from-wastewater market in 2026? The wastewater-derived biogas segment is sized at $18–22B in 2026, with a projected 6.5–8.5% CAGR taking it to $28–32B by 2030, pulled by EU Methane Regulation enforcement, China dual-carbon targets, and industrial energy prices in the $35–55/MWh band across Europe.
Which wastewater digester is best for brewery effluent? UASB and EGSB are the 2026 default for brewery, beverage, and food-processing streams with COD of 5,000–30,000 mg/L, delivering 80–90% COD removal at 4–12 hour HRT and $1,200–$2,500/m³ capex; EGSB adds tolerance for cooler reactor temperatures down to 10–20°C.
How long is the payback for industrial wastewater biogas in 2026? Industrial payback ranges from 3 to 10 years depending on influent strength, reactor choice, and end-use of the gas: brewery 3–5 years, dairy and slaughterhouse 4–7 years, pulp & paper 5–7 years, and pharma 7–10 years.
What regulations are shaping biogas from wastewater in 2026? Three: EU Methane Regulation 2024/1787 (mandatory methane capture and upgrading reporting by 2027), China's 14th Five-Year Plan biogas capacity targets and 2026 subsidy reform favouring industrial projects, and US IRA Section 45V clean-fuel production credits supporting 10–20 year biomethane offtake PPAs.
Can pharmaceutical wastewater be treated for biogas? Yes, but with caveats: APIs and solvents inhibit methanogens, so equalization, toxicity screening, and often upstream carbon or AOP polishing are required. AnMBR is the most common 2026 reactor choice for pharma, at 7–10 year payback and 3–6 m³ CH₄/m³ feed yield — viable case-by-case, rarely off-the-shelf.