Where the Smart Water Market Stands in 2026
The global smart water management market is projected to reach US$22.6 billion in 2026 and US$50.9 billion by 2033, a 12.3% CAGR that is accelerating from the 11.7% historical CAGR recorded between 2020 and 2025 (per the Smart Water Management Market report, January 2026). Three demand drivers explain the curve: rising freshwater scarcity in manufacturing regions, non-revenue water losses above 30% in many municipal networks, and the 2024–2026 drop in IoT module and edge-AI chip pricing, which has pulled sensor CAPEX down by roughly 25–40% over three years.
Geographically, North America led the 2025 market on the back of AMI rollout and leak-detection programs, but Asia-Pacific is the fastest-growing 2026 region, with China and India adding new industrial wastewater reuse capacity that requires monitoring instrumentation by design, not retrofit (Smart Water Management Market, January 2026). The industrial wastewater segment sits inside the report's "industrial and commercial behind-the-meter" bucket, which the analysts call the highest-margin 2026 opportunity because the value is OPEX reduction and reuse-water revenue rather than avoided water loss.
That distinction matters for plant engineers justifying a 2026 upgrade. Municipal smart-water spend goes to AMI, leak detection, and customer-side analytics; industrial smart-water spend goes to process optimization, compliance automation, and water reuse. The unit economics — chemical savings, energy reduction, avoided non-compliance — are different, and so is the procurement logic.
The Four Technology Layers Defining 2026 Smart Monitoring
The 2026 smart-monitoring stack is best understood as four independently purchasable layers. Most plants buy them sequentially, not as a single platform, and each layer has a different vendor ecosystem and a different payback profile.
Layer 1 is the IoT sensor layer: online probes for pH/ORP, dissolved oxygen (DO), conductivity, total suspended solids (TSS), turbidity, ammonia, nitrate, phosphate, UV254-correlated COD, and FOG. Typical 2026 pricing runs US$2,000–$15,000 per probe for the instrument alone, plus US$500–$2,000 per year for service and consumables. Layer 2 is edge AI: a PLC plus an industrial gateway running anomaly detection, soft-sensor inference, and PID auto-tuning locally, with cycle times of 1–10 seconds (per the 2026 Smart Water Tech Innovations trend document, Scribd, 2026). Layer 3 is the digital twin, a virtual replica of a single unit process such as an MBR tank or a DAF basin, updated in near-real time from Layer 1, used for what-if dosing scenarios and operator training. Layer 4 is cloud SCADA: historian, dashboards, alarm aggregation, and optional hosted ML models, typically architected as described in the SCADA System for Industrial Wastewater Plant: 2026 Engineering Guide.
| Layer | Function | Typical 2026 CAPEX (500 m³/d plant) | Primary Vendor Type |
|---|---|---|---|
| 1 — IoT sensors | Online pH, DO, TSS, NH₄, NO₃, PO₄, UV254, FOG | US$20K–$90K (8–12 probes) | Instrument OEMs, distributors |
| 2 — Edge AI / PLC | Local anomaly detection, PID tuning, soft sensors | US$10K–$40K (gateway + software) | PLC vendors, IIoT platforms |
| 3 — Digital twin | Virtual unit-process replica for what-if and training | US$60K–$250K (single process) | Process OEMs, niche DT vendors |
| 4 — Cloud SCADA / data lake | Historian, dashboards, alarm escalation, ML hosting | US$40K–$150K (capex) + US$10K–$30K/yr | SCADA vendors, hyperscalers |
Stacking all four layers is not the only path. Many 2026 pilots start at Layer 1 plus a thin Layer 2 gateway, defer the digital twin to year two, and never move beyond cloud dashboards. The framework matters because it lets you size a budget against a specific process outcome, not against a vendor's "platform" pitch.
Smart Monitoring by Process: MBR, DAF, Dosing, Sludge, and Discharge
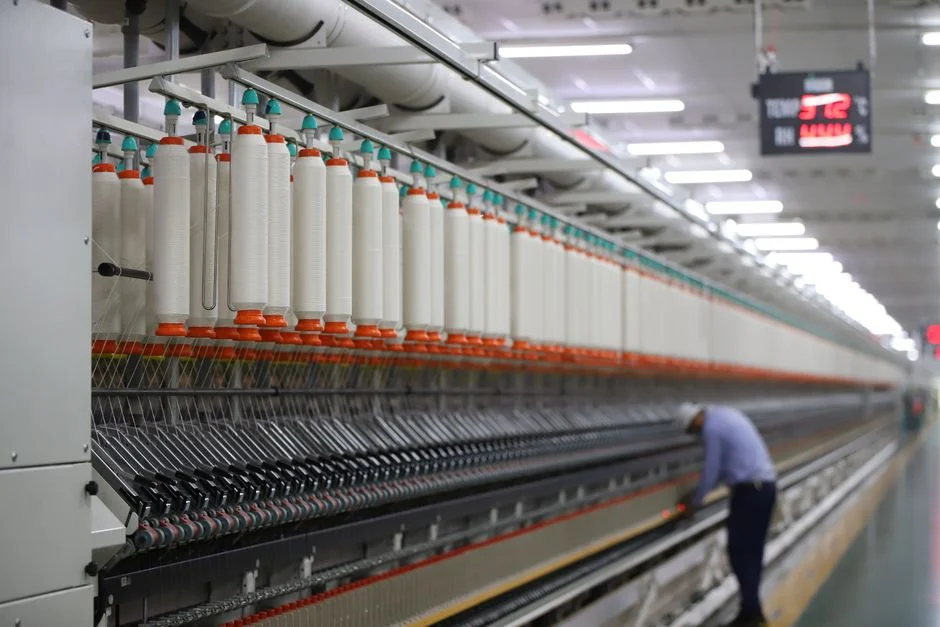
Mapping the abstract trend list onto real unit operations is where the 2026 buying decision actually happens. The five processes below cover roughly 80% of the smart-monitoring CAPEX at a typical 50–5,000 m³/day industrial plant.
MBR. A smart MBR runs on four high-frequency data streams: transmembrane pressure (TMP), membrane flux, mixed-liquor suspended solids (MLSS), and aeration DO. A digital twin of the MBR uses these plus influent COD/BOD to predict fouling 24–72 hours before the TMP-step that triggers a chemical cleaning, which is the single largest unplanned-maintenance line item in most MBR plants (see the MBR Market Growth 2026 Outlook: Size, Drivers & Tech Shifts for sizing context — US$4.1B in 2026, US$6.8B by 2033, 8.9% CAGR). On the hardware side, the MBR membrane bioreactor with smart TMP and aeration monitoring is a representative 2026 platform.
DAF. The smart DAF pairs online TSS on the influent and float solids with image-based scum detection; the AI tunes polymer dose 15–30% below a manual setpoint, depending on the variability of the influent (per typical industrial benchmarks, HydropureWater field data, 2026). The DAF system with online TSS and AI-tuned polymer dosing is the canonical 2026 reference design.
Chemical dosing. A PLC-controlled automatic chemical dosing system on a smart platform uses inline streaming-current and pH feedback to retune coagulant and pH-adjustment pumps within hours of a feedstock change, versus days for a manual jar-test loop. This is the most common Tier 2 → Tier 3 jump in 2026 plant retrofits.
Sludge dewatering. Filter-press cycle optimization runs on cake-moisture sensing and ramped feed-pressure profiles, typically trimming 5–10% off polymer use and 8–15% off cycle time. The economics are detailed in the filter press operating cost 2026 reference (HydropureWater engineering note, 2026) and apply directly to the linked plate-frame filter press platform.
Discharge compliance. Online analyzers for phosphate, nitrate, ammonia, and TSS feed the compliance log; the Online Phosphate Analyzer for Wastewater Treatment Plant: 2026 Engineering Guide describes the canonical PO₄ instrument (typical 2026 price band US$8K–$18K for the analyzer, plus US$1.5K–$3K/year in reagent and service).
| Process | Key 2026 Sensors | AI / DT Use Case | Typical 2026 OPEX Impact |
|---|---|---|---|
| MBR | TMP, DO, MLSS, flux, NH₄ | Fouling prediction, aeration control | 15–25% aeration energy cut; 20–30% fewer CIP events |
| DAF | Influent TSS, float solids, polymer flow | Polymer dose optimization | 15–30% polymer reduction |
| Chemical dosing | Streaming current, pH, ORP, flow | Self-tuning setpoints | 10–20% coagulant cut; hours vs. days to retune |
| Sludge dewatering | Cake moisture, feed pressure, cake thickness | Cycle-time and ramp optimization | 5–10% polymer; 8–15% cycle time |
| Discharge compliance | PO₄, NO₃, NH₄, TSS, pH | Anomaly detection, auto-reports | Lower non-compliance risk; 50–80% less lab labor |
A Four-Tier Adoption Framework: Manual, Sensor, Connected, Autonomous
The most useful 2026 decision tool is a tier model. It locates your plant on a maturity axis and matches each step to a CAPEX band and a payback window you can defend to procurement.
Tier 1 — Manual. Grab samples, lab tests, paper logs. Baseline for 50 m³/day plants and for facilities in jurisdictions with no continuous-monitoring mandate. 2026 status is "legacy" in any regulated EU or U.S. plant above 500 m³/day.
Tier 2 — Sensor. Two to six online probes, local PLC, no central historian. Typical 2026 CAPEX for a 500 m³/day plant: US$30K–$80K. Payback: 12–24 months, driven by chemical savings and one avoided non-compliance event per year on average (HydropureWater field data, 2026).
Tier 3 — Connected. Full sensor suite plus cloud SCADA, alarm aggregation, and monthly compliance auto-reports. Typical 2026 CAPEX: US$120K–$300K. Payback: 18–36 months, with the additional value coming from labor reduction (0.5–1 FTE per shift in alarm triage) and faster root-cause analysis.
Tier 4 — Autonomous. Digital twin plus ML-based dosing and aeration control plus predictive maintenance. Typical 2026 CAPEX: US$400K–$1.2M for a 500 m³/day plant. Payback: 24–48 months, but the unlock is reuse-water revenue (a reuse line priced at US$0.50–$2.00/m³ against avoided freshwater of US$1.50–$4.00/m³) and labor reduction of 1–2 FTE per shift.
| Tier | Scope | 2026 CAPEX (500 m³/d) | Payback Window | Headline KPI |
|---|---|---|---|---|
| 1 — Manual | Grab samples, lab, paper logs | < US$5K/yr OPEX | n/a | Compliance by attestation |
| 2 — Sensor | 2–6 probes + local PLC | US$30K–$80K | 12–24 mo | 10–20% chemical cut |
| 3 — Connected | Full suite + cloud SCADA + reports | US$120K–$300K | 18–36 mo | 0.5–1 FTE/shift labor offset |
| 4 — Autonomous | Digital twin + ML control + predictive maintenance | US$400K–$1.2M | 24–48 mo | Reuse-water revenue + 1–2 FTE/shift |
For most 2026 industrial plants in the 50–5,000 m³/day band, the right pilot is a Tier 2 → Tier 3 jump scoped to a single high-cost process, not a full Tier 4 leap.
Implementation Roadmap: A 12–24 Month Path to Tier 3
A sequenced rollout keeps risk bounded and lets you prove value before asking for the next budget line.
- Phase 1 (months 1–3): instrument audit, sensor selection on the highest-impact loops, and a SCADA gap analysis. Output: a Tier 2-to-Tier 3 specification tied to a named unit process.
- Phase 2 (months 4–9): install online analyzers on effluent nutrients, influent TSS, and DO on the aeration basin; integrate to the existing PLC without replacing it.
- Phase 3 (months 10–18): deploy the cloud historian, dashboards, alarm escalation, and monthly compliance auto-reports. Operators run parallel with paper logs for 30–60 days.
- Phase 4 (months 19–24): pilot a digital twin on the highest-cost unit process (typically chemical dosing or MBR aeration) and benchmark against baseline OPEX. Use the delta to underwrite the Tier 4 business case.
A 500 m³/day plant that follows this sequence typically lands inside the 18–36 month Tier 3 payback band, with chemical savings of 10–20% and aeration-energy savings of 8–15% (HydropureWater field data, 2026). Energy savings alone, at an industrial electricity tariff of US$0.08–$0.14/kWh, can return US$15K–$60K per year on a 500 m³/day MBR plant, which shortens payback materially.
Frequently Asked Questions
What is the 2026 CAPEX range for a Tier 3 smart-monitoring retrofit on a 500 m³/day industrial wastewater plant? US$120,000–$300,000 in 2026, depending on the number of online analyzers, SCADA license model, and whether the cloud layer is built on a hyperscaler or an on-prem historian (HydropureWater field data, 2026).
Which smart-monitoring technology gives the fastest payback in 2026? AI-tuned polymer dosing on a DAF or sludge dewatering press, because polymer is typically the single largest variable chemical cost and AI cuts it 15–30% without capital-intensive process changes (per typical industrial benchmarks, 2026).
Do I need a digital twin to comply with 2026 discharge regulations? No. Compliance requires online analyzers and a defensible data log; a digital twin is an optimization layer that pays back through OPEX reduction and reuse-water revenue, not compliance.
How long does a Tier 2 → Tier 3 retrofit take in 2026? 12–18 months for a 500 m³/day plant, with the longest path being instrument procurement (8–14 weeks lead time for phosphate and ammonia analyzers in 2026) and PLC integration.
What is the biggest risk in a 2026 smart-monitoring upgrade? Data quality from poorly maintained probes, not the software. A Tier 3 platform running on dirty sensors produces false alarms and erodes operator trust faster than any other failure mode, so probe maintenance must be in the budget from day one.