What RO System Capacity Really Means in 2026
RO system capacity is the design permeate flow in m³/day at 25 °C and a stated feed TDS, not raw feed flow. Capacity sizing sets membrane count, vessel array, pump duty, and energy recovery so design capacity holds after 10–15% first-year flux decline. Industrial BWRO typically recovers 65–85% of feed; SWRO recovers 35–50% before energy recovery.
Vendor proposals often conflate capacity with feed flow, and the mix-up costs buyers membrane area, energy, and concentrate-discharge compliance margin. Design capacity is the guaranteed end-of-first-year permeate flow. Nominal capacity is day-one flow, typically 10–20% above design. Peak turndown is usually 50–70% of nominal, held by VFD pump speed and permeate throttling.
In 2026, three forces make precise sizing financially unavoidable. Industrial electricity tariffs in the EU and China have risen 8–15% year-on-year since 2024. Every extra percentage point of unnecessary feed flow inflates pumping OPEX. Discharge permits for brine are tightening, with the EU Industrial Emissions Directive revision (2025-11) pushing concentrate TDS limits in several sectors.
At the same time, the desalination market growing at 9.1% CAGR through 2033 has pulled membrane supply toward larger 8-inch formats and higher-recovery chemistry. Legacy 60–70% recovery designs are economically obsolete in many food, pharma, and power retrofits. Industrial RO skids with PLC automation hold turndown within ±2% of setpoint only when the array and pump are sized against design capacity, not nominal.
Capacity Sizing Flow: From Feedwater to Permeate Spec
The sizing flow for an industrial reverse osmosis system runs in five repeatable steps, and every step produces a number that locks in part of the CAPEX. Most plants we size for food and power make-up run recovery at the lower end of the BWRO band until a full 12-month feedwater record is in hand.
- Characterise the feedwater. Pull a 12-month rolling average of TDS (mg/L), temperature (°C), SDI₁₅, pH, free chlorine, hardness as CaCO₃, silica, and TOC. A single sample is the most common cause of under-sized pretreatment and oversized pumps.
- Define the permeate spec and recovery. Target conductivity (µS/cm), TDS (mg/L), and recovery rate. BWRO at 65–85% is the industrial norm; SWRO at 35–50% before energy recovery. According to US EPA (2024), RO target recovery in drinking-water cost models typically sits between 50% and 85%. Standard designs often sit at 75–85% above 0.5 MGD.
- Run the mass balance. Permeate flow = Feed flow × Recovery. Concentrate flow = Feed flow × (1 − Recovery). Check Stiff-Davis and Langelier saturation indices on the concentrate before confirming recovery.
- Apply temperature correction. RO membrane flow varies 1.5–2% per °C. Winter feed temperatures (often 8–15 °C in northern China, the EU, and the US Midwest) typically dictate membrane count, not summer peak.
- Pick the array. A 2:1 array delivers 65–75% recovery in BWRO; a 3:2:1 or 4:2:1 array is used for 80–85% brackish recovery. SWRO is usually 2:1 first pass with isobaric energy recovery.
Worked example for a 500 m³/day BWRO permeate target at 75% recovery, 15 LMH design flux, and 25 °C reference temperature: feed flow = 500 / 0.75 = 667 m³/day. Membrane area = (500 m³/day × 1000) / (24 h × 15 L/m²·h) = 1,389 m². That area equals about 34 standard 8-inch 440 ft² (≈40.9 m²) elements.
Field layouts commonly use a 6-vessel 2:1 first stage and a 3-vessel 1:1 second stage (HydropureWater field data, 2026). The same calculation feeds directly into the array table below.
| Sizing step | Input | Typical 2026 industrial value | Output |
|---|---|---|---|
| Feed characterisation | TDS / SDI / temp | 1,500 mg/L / SDI 3 / 15 °C | Design basis |
| Recovery selection | Feed TDS & scaling indices | 75% (BWRO) | Concentrate 3,750 mg/L |
| Mass balance | Feed = permeate / recovery | 667 m³/day feed for 500 m³/day permeate | 167 m³/day concentrate |
| Temperature correction | Winter design temperature | 1.5–2% per °C delta | +8–10% membrane area vs 25 °C |
| Membrane area | Permeate / flux | 15 LMH, 25 °C | 1,389 m² for 500 m³/day |
| Array configuration | Recovery & scaling | 2:1 (75%) or 3:2:1 (80–85%) | Pressure-vessel count |
Walk the same path with a qualified vendor before signing the PO. The industrial RO system datasheet should publish flux at the design temperature, not at 25 °C, and should show the concentrate scaling index used to set recovery.
Membrane Element Selection and Array Design
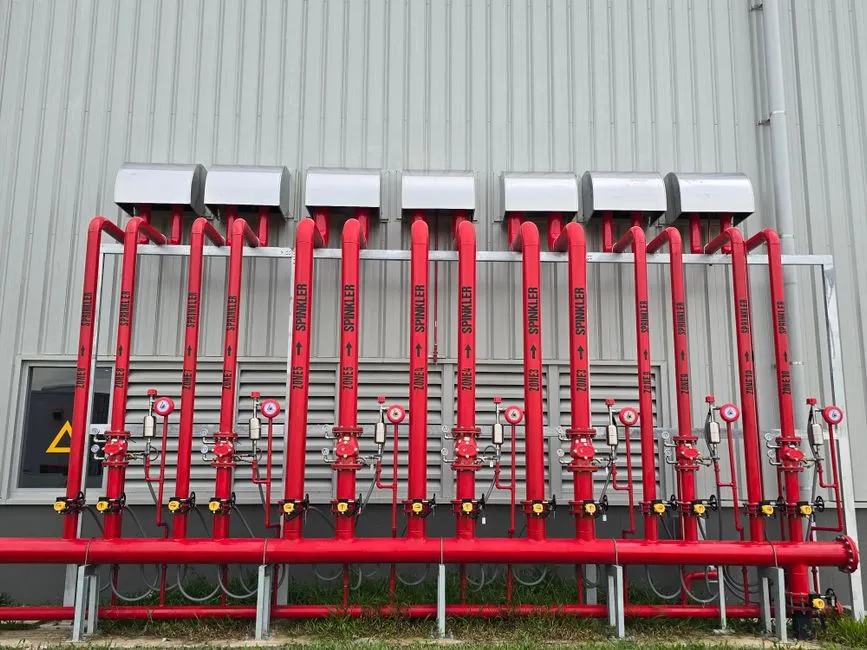
Element selection locks in 60–70% of the long-term OPEX, because flux, rejection, and fouling tendency are baked into the element chemistry. Brackish RO elements in 8-inch 440 ft² format run at 10–15 bar and dominate the 1,000–10,000 mg/L TDS range. Seawater elements are 8-inch 400 ft² at 55–85 bar, paired with isobaric or turbocharger energy recovery to bring specific energy down to 2.5–4 kWh/m³ permeate.
Where feed SDI₁₅ sits consistently at 3–5, a fouling-resistant (FR) element pays back the 10–20% cost premium in extended cleaning intervals. Below SDI 3, a standard BW element is the lower-OPEX choice. US EPA (2024) notes that manufacturers typically specify maximum feed SDI values of 3 to 5 for RO and NF elements. The same model lists flux ranges of roughly 10–20 gfd by groundwater versus surface water and SDI band.
A 15 LMH industrial design flux remains a conservative winter basis for many process feeds. Drinking-water models may allow higher gfd on clean groundwater. Array ratio is the second decision that determines long-term reliability. The permeate-to-feed flow ratio in the last pressure vessel should sit between 2.5–3.5:1.
Below that range, the tail element fouls rapidly; above it, the lead element does not produce enough permeate per square metre. For 80%+ recovery on hard feedwater, use a 3:2:1 or 4:2:1 array with an interstage booster. That layout is standard when last-stage concentrate TDS exceeds the element osmotic limit.
Industrial RO systems with concentrate recycle can reach 95% recovery on select low-scaling feeds. That path still needs antiscalant dosing and pH control sized for the recycle stream.
| Element family | Format | Operating pressure | Feed TDS range | Specific energy | Notes |
|---|---|---|---|---|---|
| BWRO standard | 8" × 440 ft² | 10–15 bar | 500–5,000 mg/L | 0.5–1.0 kWh/m³ | SDI ≤3 feed |
| BWRO fouling-resistant | 8" × 440 ft² | 10–15 bar | 500–5,000 mg/L | 0.6–1.1 kWh/m³ | SDI 3–5 feed |
| BWRO high-recovery | 8" × 440 ft² | 12–18 bar | 2,000–10,000 mg/L | 0.8–1.2 kWh/m³ | 3:2:1 or 4:2:1 array |
| SWRO standard | 8" × 400 ft² | 55–85 bar | 30,000–45,000 mg/L | 2.5–4.0 kWh/m³ | ERD required >1,000 m³/day |
Element choice, array, and pump pressure must be quoted together. The industrial RO system selector on the vendor side should publish all three against the same feedwater basis.
Pretreatment: The Sizing Variable Most Buyers Underestimate
Pretreatment is where most RO trains underperform or fail early. A multi-media filter sized to SDI ≤3 is the baseline feed specification for any polyamide RO element. Without it, membrane life drops from 3+ years to 12–18 months in food and pharma feed.
Activated carbon or chlorine dioxide dosing removes residual oxidant. Free chlorine above 0.1 ppm damages polyamide chemistry within hours. Antiscalant dosing is mandatory when concentrate Stiff-Davis index exceeds +0.5. It is also required when silica approaches 120 mg/L in the reject stream.
In food and oil-processing plants, put a DAF or oil-removal stage ahead of the multi-media filter. Otherwise FOG can blind the RO membrane within weeks. The pretreatment train is sized as part of the RO system, not as a separate line item.
A multi-media filter matched to RO feed flow and SDI target cuts fouling risk. Pair it with an automatic chemical dosing skid for coagulant, antiscalant, and pH adjustment to remove the largest source of RO warranty disputes.
For pharma and food plants, RO feed disinfection may sit inside the HACCP or WFI boundary. The matched chlorine dioxide generator range of 50 g/h to 20,000 g/h covers oxidant removal. It avoids the bromate formation risk of bulk sodium hypochlorite at high pH.
Energy, Pump, and Brine Discharge Sizing
BWRO specific energy sits at 0.5–1.2 kWh/m³ permeate, and SWRO at 2.5–4.0 kWh/m³ with an energy recovery device (ERD). Earlier industrial guidance used that 2.5–4.0 kWh/m³ SWRO band. A 2025 Guinness-verified DESALRO 2.0 demo plant recorded 1.794 kWh/m³ at 40% recovery, 37 g/L feed salinity, and 22 °C.
Above 1,000 m³/day permeate, an isobaric or turbocharger ERD is a standard line item that cuts SWRO energy by 30–60%. Payback often falls inside 12–24 months at industrial electricity tariffs above USD 0.08/kWh. For BWRO, the high-pressure pump selection matters less for energy and more for hydraulic turndown.
Multistage centrifugal pumps dominate above 100 m³/day. Positive-displacement pumps are reserved for SWRO or small high-pressure trains below 50 m³/day. Those duties are where turndown and net positive suction head become limiting. Brine discharge is a sizing variable, not a permit afterthought.
Concentrate volume = feed × (1 − recovery). A 667 m³/day feed at 75% recovery produces 167 m³/day of concentrate that must meet local discharge limits. China GB/T 31962, EU 91/271/EEC, and US EPA NPDES each set different caps. Limits for TDS, chloride, and dissolved solids vary by receiving water body.
The 2026 revisions to industrial discharge rules tighten fluoride and concentrate limits in several sectors. See the 2026 fluoride and concentrate discharge standards guide. Calculate concentrate chemistry at design stage, not after the skid lands on site.
2026 CAPEX and OPEX Snapshot by RO Capacity Band
The table below bands 2026 industrial RO skid CAPEX before pretreatment, installation, and civil works. Use it to sanity-check vendor quotes. SWRO is roughly 2.2–2.5× BWRO at equivalent permeate flow. The gap comes from high-pressure pump and ERD cost.
Pretreatment (MMF + carbon + dosing skid) typically adds 25–40% to total RO system CAPEX. Installation, instrumentation, and civil works add another 20–35% on top of that.
OPEX is dominated by energy at 45–60% of annual cost. Membrane replacement every 3–5 years accounts for 10–15%, chemicals 5–10%, and labour 10–20%. Figures are HydropureWater field data, 2026, cross-referenced against the broader 2026 industrial wastewater market trends report.
| Permeate capacity | BWRO CAPEX (skid only) | SWRO CAPEX (skid + ERD) | Typical array | High-pressure pump |
|---|---|---|---|---|
| 50 m³/day | USD 40,000–75,000 | USD 95,000–175,000 | 1:1 or 2:1 | Multistage centrifugal, 7.5–11 kW |
| 250 m³/day | USD 200,000–375,000 | USD 475,000–900,000 | 3:2 or 4:2 | Multistage centrifugal, 30–55 kW |
| 500 m³/day | USD 400,000–750,000 | USD 950,000–1,800,000 | 6:3 or 4:2:1 | Multistage centrifugal, 75–110 kW |
| 1,000 m³/day | USD 800,000–1,500,000 | USD 1,900,000–3,600,000 | 8:4 or 6:3:2 | Multistage centrifugal + VFD, 150–220 kW |
For high-purity applications downstream of RO, polishing train cost is a separate line item. That includes semiconductor, pharma WFI, and power plant make-up. The semiconductor ultrapure water system cost 2026 benchmark is a useful parallel reference.
Sizing Decision Framework: Which RO Configuration Fits Your Plant
The decision tree below routes a feedwater spec and permeate demand to a specific RO architecture. It then points to the matched pretreatment equipment. Use the worst-case 12-month feedwater number as the input, not the average. Under-sized pretreatment will dominate OPEX for the next 5 years.
| Feed TDS & demand profile | RO architecture | Array | Element type | Pretreatment train |
|---|---|---|---|---|
| Feed TDS < 2,000 mg/L, < 100 m³/day | Single-pass BWRO | 2:1 | Standard BW | MMF + dosing skid |
| Feed TDS 2,000–10,000 mg/L | Single-pass BWRO, high-recovery | 3:2:1 or 4:2:1 | Fouling-resistant BW + antiscalant | MMF + carbon + dosing skid + ClO₂ |
| Feed TDS > 10,000 mg/L | SWRO or two-pass BWRO | 2:1 + ERD | SWRO standard | MMF + carbon + dosing skid + ClO₂ + DAF if FOG present |
| Permeate spec < 10 µS/cm | Two-pass RO or RO + mixed-bed | Second pass sized at 85–90% of first pass | BW high-rejection | Full train + polisher skid |
Every branch of that table terminates at the same matched equipment set. The industrial RO system is the integration point, with a multi-media filter ahead of it.
An automatic chemical dosing skid covers antiscalant and pH. A chlorine dioxide generator is added when feed disinfection or oxidant removal is in scope. Sizing all four against a single feedwater basis turns an RO project from a procurement gamble into a 5-year operating asset.
Buyer Checklist Before You Sign the PO
Use this checklist to pressure-test any RO quote after capacity sizing against the same feedwater basis.
- 12-month feed TDS, temperature, SDI₁₅, hardness, silica, and TOC on the datasheet
- Design capacity stated at end-of-first-year flux, not day-one nominal
- Recovery fixed after concentrate Stiff-Davis / Langelier check
- Membrane area quoted at winter design temperature, not only 25 °C
- Array ratio and last-vessel concentrate flow within 2.5–3.5:1 permeate-to-feed
- Pretreatment sized to SDI ≤3 with antiscalant and oxidant control included
- Concentrate volume and chemistry checked against the local discharge permit
Who This Is For and Next Step
This guide is for plant engineers, EPC contractors, and procurement managers sizing BWRO or SWRO between roughly 50 and 1,000 m³/day. Teams buying only a cartridge under-sink unit should look elsewhere. So should municipal mega-desalination EPC packages above several thousand m³/day.
When your feedwater record and permeate target are ready, request a matched train quote through the industrial RO inquiry form. That keeps membrane area, array, pump, and pretreatment on one design basis.
Frequently Asked Questions
What is the typical recovery rate for an industrial BWRO system in 2026?
Industrial BWRO runs at 65–85% recovery, with 75% as the most common 2026 design point for food, pharma, and power make-up. Above 85%, concentrate scaling indices (Stiff-Davis) require antiscalant dosing and tighter pH control, typically within ±0.2 pH units. US EPA (2024) drinking-water cost models likewise place typical RO recovery between 50% and 85% depending on plant size and feed quality.
How much membrane area is needed for 500 m³/day of permeate at 15 LMH flux?
Approximately 1,389 m² of membrane area, which is 34 standard 8-inch 440 ft² elements arranged in a 6:3 vessel array. At 12 LMH (a more conservative winter design flux), the same train needs around 1,736 m² or 43 elements. Always correct that area for winter feed temperature before locking CAPEX.
What feedwater SDI is acceptable for a polyamide RO membrane?
SDI₁₅ ≤ 3 is the standard RO feed specification for long membrane life. Between SDI 3 and 5, a fouling-resistant element extends cleaning intervals. Above SDI 5, the multi-media filter upstream is under-sized and must be re-evaluated before the RO train starts up. Manufacturers commonly cap allowable feed SDI at 3 to 5 for RO/NF elements (US EPA, 2024).
How much does a 250 m³/day industrial RO system cost in 2026?
The skid-only CAPEX for a 250 m³/day BWRO unit sits at USD 200,000–375,000 in 2026. Adding the matched pretreatment train (MMF + dosing skid + ClO₂) brings the total system CAPEX to roughly USD 280,000–525,000, excluding installation and civil works (HydropureWater field data, 2026). SWRO at the same permeate flow is typically 2.2–2.5× that BWRO skid band.
When does an energy recovery device make economic sense on RO?
An isobaric or turbocharger ERD is standard on SWRO trains above 1,000 m³/day permeate, where it cuts specific energy from 5–7 kWh/m³ down to 2.5–4 kWh/m³. A 2025 Guinness-verified demo plant recorded 1.794 kWh/m³ at 40% recovery (DESALRO 2.0). On BWRO, ERDs are rarely justified because the feed-to-permeate pressure differential is too small to recover economically.