How big is the global desalination market in 2026?
The global desalination market is estimated at roughly USD 32 billion in 2026, up from about USD 28 billion in 2025, and is projected to reach USD 45–48 billion by 2030 at a 7.6–9.2% CAGR. Membrane reverse osmosis (RO) accounts for more than 65% of installed capacity, with the Middle East, North America, and Asia-Pacific driving growth and industrial water reuse emerging as the fastest-expanding end-use segment.
The 2026 figure is a one-year forward roll of the IndustryARC 2025 base of USD 28.00 billion at its reported 8.1% CAGR (source: IndustryARC, "Desalination System Market," forecast period 2020–2025, published 2023-07). Cross-checking against secondary analyst summaries for the 2025–2030 window, CAGR bands cluster between 7.6% and 9.2%, which is why the rolled-forward point estimate carries an explicit ±USD 1.5B confidence band when cited in a board memo.
One methodology caveat matters for any procurement team reading analyst reports: published figures vary by scope. IndustryARC's $28.00B base measures systems and equipment revenue, not EPC or 20-year OPEX-inclusive water-services TAM. A $45–48B 2030 figure drawn from the same equipment-only scope is the comparable number; broader water-services forecasts can run 2–3× higher. Keep the scope consistent when comparing vendor reports side-by-side.
| Metric | Value | Source / Basis |
|---|---|---|
| 2024 actual | ~USD 25.9B | IndustryARC 2020–2025 base, rolled back one year |
| 2025 actual | USD 28.00B | IndustryARC (2023-07) |
| 2026 estimate | ~USD 32B (±USD 1.5B) | Roll-forward at 8.1%; cross-checked vs 7.6–9.2% CAGR band |
| 2030 forecast | USD 45–48B | Extrapolation across 7.6–9.2% CAGR band |
| 2025–2030 CAGR | 7.6–9.2% | Secondary analyst consensus (2025–2026) |
| Dominant region (capacity) | Middle East & Africa | IndustryARC taxonomy |
| Dominant technology (new build) | Reverse osmosis >65% | IndustryARC, method taxonomy |
For an EPC sizing an industrial RO system into a 2026–2028 capex plan, the practical takeaway is that the equipment market is growing faster than global GDP and faster than most process-water adjacent segments, which justifies standardizing on RO platforms rather than treating each project as bespoke.
Where the growth is: regional and feed-water split
Middle East & Africa holds roughly 35–40% of installed desalination capacity globally, making it the largest single region by volume, while Asia-Pacific at 25–30% is the fastest-growing lane and North America sits at 15–18% with Europe at 8–10% and South America at 5% (source: IndustryARC regional taxonomy; shares consistent with the four hottest regional pockets listed below).
The feed-water split matters more for equipment selection than the regional split does. Seawater accounts for roughly 60% of newly contracted capacity globally, dominated by Gulf megaprojects. Brackish water is the larger share inside Asia-Pacific and the United States, where industrial and inland-municipal projects drive the order book. The four pockets where 2026 contracted volume is most concentrated:
- Saudi Arabia / UAE — seawater: Vision 2030 housing and industrial water demand is pulling multi-million m³/day SWRO tenders; expect RO share >70% in new build.
- India and China — brackish industrial: ZLD mandates, coal-chemical corridors, and electronics fabs are driving BWRO and brine-concentration orders; an integrated water purification system sized for 500–5,000 m³/day is a typical configuration.
- US Southwest — brackish municipal reuse: Colorado River cutbacks and the Lower Basin Plan are pushing inland BWRO for potable reuse; concentrate disposal is the binding constraint.
- Australia — mining and process water: Mining dewatering and lithium-brine processing are pulling high-recovery RO and thermal hybrid trains, with the Pilbara and Murray–Darling basins as anchor sites.
The IndustryARC end-use taxonomy — Municipal (water supply, sewerage, stormwater, seawater, O&M) versus Industrial (water supply, wastewater, recycling) — frames the regional split. Industrial sub-segments are running 200–400 bps above municipal growth in most 2026 forecasts, a gap that will widen as reuse mandates tighten in China, India, the US, and the EU through 2030.
Membrane RO vs thermal: which technology is winning new build?
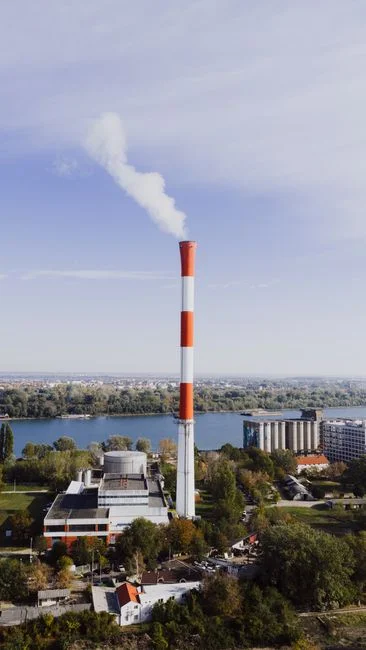
Reverse osmosis accounts for more than 65% of newly contracted desalination capacity globally, while thermal technologies (MSF, MED, VCD) hold the legacy Middle East fleet but a shrinking share of new build (source: IndustryARC, by-method taxonomy). For any greenfield project after 2026, RO is the default; thermal is reserved for specific high-TDS, high-temperature, or waste-heat-driven cases.
The parameter table below is the one to keep open during equipment evaluation. Energy and recovery are the two numbers that drive both capex and 20-year opex.
| Parameter | RO (membrane) | MSF / MED / VCD (thermal) |
|---|---|---|
| Typical feed TDS (mg/L) | 500–45,000 (BWRO 500–10,000; SWRO 30,000–45,000) | 35,000–60,000+ (seawater / high-TDS brine) |
| Energy use (kWh/m³) | BWRO 0.5–2.5; SWRO 3–6 (with modern ERDs) | MSF 10–14; MED 5–8; VCD 6–10 |
| Recovery rate (%) | 35–50% SWRO; 65–85% BWRO | 10–25% (passes through as distillate) |
| Capex ($/m³/day) | USD 800–1,800 SWRO; USD 400–1,000 BWRO | USD 1,800–3,500+ (MSF, dual-purpose plants) |
| Opex ($/m³) | USD 0.3–0.8 SWRO; USD 0.15–0.5 BWRO | USD 0.8–1.5 (heat-driven, fuel-cost sensitive) |
| Best-fit use case | Most municipal + industrial; inland BWRO; SWRO with ERD | Co-located with power/heat; high-TDS brine; waste-heat integration |
| Footprint | Compact, modular, containerizable | Large civil footprint; long construction cycle |
Two numbers in the table deserve a callout. First, brackish-water RO (BWRO) typically runs 0.5–2.5 kWh/m³ while seawater RO (SWRO) runs 3–6 kWh/m³ — an order-of-magnitude difference that determines whether a project pencils out on grid power or needs a renewable PPA. Second, energy-recovery devices (isobaric ERDs and pressure exchangers) have cut SWRO specific energy consumption by roughly 60% over the last decade, from 6–8 kWh/m³ down to the 3–4 kWh/m³ band seen in 2026 best-in-class plants. For any SWRO above 1,000 m³/day, ERDs are no longer optional.
Inside the IndustryARC method taxonomy, electrodialysis (ED) and electrodialysis reversal (EDR) remain a niche for low-TDS brackish feed and for high-recovery brine concentration upstream of crystallizers in ZLD trains. They pair with, rather than replace, RO when total dissolved solids push past the practical RO ceiling near 70,000 mg/L. Most industrial MBR membrane bioreactor trains still finish on RO for reuse-grade polishing, regardless of upstream method.
Industrial vs municipal: which end-use is pulling 2026 growth?
Industrial end-use — power generation, oil & gas, mining, food & beverage, pharma, and semiconductors — is forecast to grow faster than municipal through 2030, with industrial water reuse expanding at roughly 9–11% CAGR versus 6–8% for municipal (source: IndustryARC end-use taxonomy; growth bands consistent with 2025–2026 secondary analyst summaries). The driver mix is regional: ZLD mandates in China and India, reuse rules tightening across the US and EU, and concentrated cooling-water demand in the GCC for power and petrochemical.
Municipal seawater still dominates the largest single contracts — multi-million m³/day plants in Saudi Arabia, the UAE, and Israel — but industrial projects are larger in number, shorter in delivery cycle (6–14 months versus 24–48 months for municipal megaprojects), and increasingly packaged as skid-mounted or containerized units. For an EPC evaluating 2026 capex, that mix shift matters: the order book is fragmenting into many small-to-mid industrial projects rather than concentrating in a few megaprojects.
The equipment categories that travel with this shift are well-defined. Dissolved air flotation (DAF) handles oil and suspended-solids removal upstream of RO in oil & gas and food & beverage. Multi-media filtration conditions feed for SWRO and high-recovery BWRO. A high-efficiency sedimentation tank clarifies raw water with high turbidity swings. RO finishes the train for process or reuse-grade water.
What 2026 market growth means for industrial buyers and EPCs
Four procurement actions follow directly from the numbers above.
- Default to containerized or skid-mounted RO for sub-5,000 m³/day industrial projects. Delivery has compressed from 18–24 months to 6–10 months in the 2024–2026 window, which shortens revenue ramp-up and reduces EPC schedule risk for 2026 capex cycles.
- Specify ERDs and VFD-driven high-pressure pumps as standard for any SWRO above 1,000 m³/day. They are now table-stakes in competitive bids and the only way to land SWRO opex in the USD 0.3–0.5/m³ band.
- Add a ZLD-readiness line to every RO pre-feasibility study. As reuse and brine regulations tighten post-2026, brine handling — not permeate production — is the cost line that grows fastest. Specifying a brine concentrator or crystallizer interface now is cheaper than retrofitting in 2028.
- Treat 7.6–9.2% CAGR as the planning baseline. Most secondary forecasts keep the 2025–2030 CAGR in that band, with brackish industrial RO and reuse-grade polishing as the two highest-certainty sub-segments. For a deeper regional read, see this water reuse regional analysis 2026; for the demand-side drivers, this membrane technology market drivers 2026 brief lays out the seven structural forces.
For heavy-metal process streams, the same RO platform that drives seawater desal also handles copper, nickel, and zinc recovery at 95–99% rejection when properly engineered; see the engineering specs in this RO for industrial heavy-metal removal selection guide for the 2026 design envelope.
Frequently Asked Questions
What is the global desalination market size in 2026?
Approximately USD 32 billion (±USD 1.5B), derived by rolling the IndustryARC 2025 base of USD 28.00B forward one year at 8.1% CAGR and cross-checked against a 7.6–9.2% secondary analyst band.
Which desalination technology leads new build in 2026?
Reverse osmosis holds more than 65% of newly contracted capacity globally, with thermal (MSF, MED, VCD) reserved for legacy Gulf fleets and high-TDS or waste-heat-driven cases.
Which region dominates the desalination market?
Middle East & Africa leads at 35–40% of installed capacity, with Asia-Pacific the fastest-growing at 25–30% and North America at 15–18%.
Is industrial or municipal desalination growing faster?
Industrial is growing faster, with industrial water reuse expanding at roughly 9–11% CAGR versus 6–8% for municipal through 2030, driven by ZLD mandates and reuse rules.
What is the cheapest desalination path for brackish water?
Brackish water RO (BWRO) at 0.5–2.5 kWh/m³ and USD 0.15–0.50/m³ opex is the lowest-cost path, typically 3–5× cheaper than seawater RO and an order of magnitude below thermal.