What a Cloud Monitoring Platform for Industrial Plants Actually Costs
Cloud monitoring platform cost in 2026 for an industrial deployment ranges $4,000–$95,000 in one-time CAPEX (gateways, instrumentation, panel integration) plus $30–$1,200 per site per month in SaaS subscription, with cellular data fees of $8–$35 per device monthly. A 5-site plant typically spends $58,000–$140,000 in year one and breaks even within 14–22 months by eliminating 60–80% of unplanned site visits.
The line items that catch first-time buyers off guard are never the SaaS subscription. They are the edge gateway, the sensor retrofit on existing skids, the cellular plan, and the integration labor to expose Modbus or OPC UA tags from a 2014-vintage PLC. A quote that shows only "$300/month per site" is a SaaS subscription quote, not a platform quote. For a defensible budget, every buyer should itemize four distinct cost layers:
- Field instrumentation — pH/ORP probes at $450–$1,200, dissolved oxygen at $900–$2,400, and high-end analyzers such as an online ammonia analyzer at $8,000–$45,000 per stream.
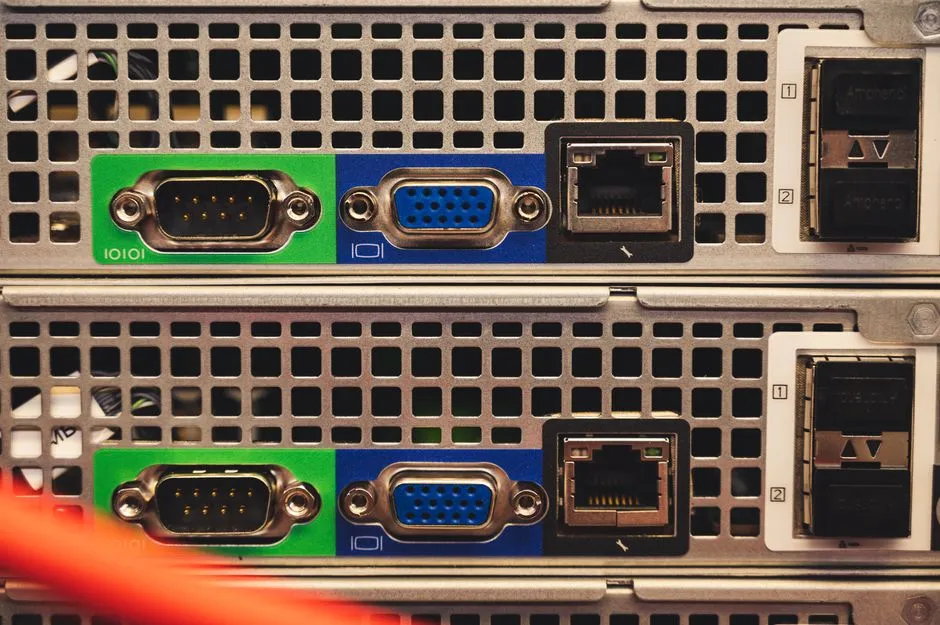
- Edge gateway hardware — IP65-rated cellular gateways with Modbus TCP and OPC UA support at $1,200–$6,500 per unit.
- Cloud SaaS subscription — tiered from $30 to $1,200 per site per month depending on tag count, retention, and analytics features.
- Connectivity and cybersecurity — cellular data $8–$35 per device, VPN tunnels, and IEC 62443-3-3 SL2 hardening, often 12–18% of integration cost.
"Free" cloud dashboards bundled with a single sensor vendor are not a free platform. They lock the buyer into one supplier for spare probes, calibration services, and gateway firmware, and benchmarks show this raises 5-year TCO by 30–50% compared with an open-protocol deployment (HydropureWater field data, 2026). A full remote monitoring system cost breakdown for wastewater plants is published separately for buyers who want to validate these numbers against their own RFQ responses.
CAPEX Breakdown: Gateway, Sensors, Panel Integration, and Installation
Itemized CAPEX for a single treatment skid typically lands between $9,500 and $32,000 before installation labor, with the IIoT gateway and PLC retrofit accounting for 45–60% of the total. Procurement teams that request this level of granularity before issuing an RFP consistently report 15–25% lower bid variance because vendors are forced to price line items rather than roll them into a lump sum.
| Component | Unit Cost (USD) | Notes |
|---|---|---|
| IIoT gateway (cellular + Modbus/OPC UA, IP65) | $1,200–$6,500 | 5-year warranty tier; supports 100–2,000 tags |
| Wired sensor per measurement point | $450–$3,800 | pH/ORP lowest; optical COD/TN highest |
| PLC retrofit to expose existing tags | $2,000–$18,000 | IEC 61131-3 programming at $95–$165/hr |
| Panel rework (DIN rail, 24 VDC, surge protection) | $800–$4,500 | Per enclosure |
| Installation labor (industrial rate) | $110–$185/hr | 8–40 hours per site |
| IEC 62443-3-3 SL2 cybersecurity hardening | +12–18% of integration cost | Mandatory for utility/food-grade sites |
For a typical 200 m³/day food-processing wastewater skid, plan on 35–60 I/O points: influent flow (magmeter, $1,800–$3,200), pH/ORP at equalization ($900–$1,400), dissolved oxygen in the aeration basin ($1,200–$2,400), and a chemical dosing system pulse-output counter ($300–$650). At the upper end, optical total nitrogen probes run $3,200–$3,800 each and require monthly reagent cartridges at $80–$140 per cartridge, which is an OPEX line rather than CAPEX.
Cybersecurity hardening is the most commonly skipped line item and the most painful to retrofit. IEC 62443-3-3 SL2 requires network segmentation, role-based access, event logging, and signed firmware — none of which is included in a default gateway configuration. Budget $4,500–$18,000 per site for the one-time package; this is non-negotiable for any U.S. water utility client and any EU industrial buyer subject to NIS2 (per IEC 62443-3-3:2013, amended 2024-09).
SaaS Subscription Tiers and What Each One Buys You
SaaS subscription is the line item vendors quote first, and the one where buyers most often misjudge their true cost. The published per-site monthly rate is the starting price, not the operating price — SMS overages, additional dashboards, and data egress fees routinely double the headline number within 18 months of go-live. The three tiers below reflect what an industrial buyer can expect to negotiate in a 3-year contract signed in 2026.
| Feature | Entry ($30/mo) | Mid ($300/mo) | Enterprise ($1,200/mo) |
|---|---|---|---|
| Tag count | 10–25 | 200–500 | Unlimited |
| Alerts | Email/SMS | Email/SMS/voice, escalation trees | + predictive ML anomaly detection |
| Data retention | 90 days | 2 years | 7 years (EPA audit-ready) |
| Users | 1 | 10 | Unlimited + SAML SSO |
| Dashboards | Standard only | Custom + multi-site fleet view | White-label + API access |
| Audit logs | No | Basic | Full, exportable (21 CFR Part 11) |
For a 5-skid wastewater plant at 50 m³/day average flow, the mid-tier covers the standard scope: 250–400 tags across lift stations, equalization, MBR train, and the MBR membrane bioreactor system permeate panel. Buyers should budget an additional $0.04–$0.12 per SMS above the included 200/month, $25–$60/month per additional custom dashboard, and $180–$450/month if a white-label mobile app is required for operator adoption. Data egress above 50 GB/month — relevant for vibration waveform or video skid monitoring — runs $0.08–$0.25 per GB on most vendor contracts (HydropureWater field data, 2026).
The entry tier fits a single lift station or pilot skid with fewer than 25 tags. The enterprise tier is required for any EPA-regulated site with multi-region operations, any plant with FDA 21 CFR Part 11 obligations, and any deployment exceeding 500 tags across more than 10 sites.
Connectivity, Cybersecurity, and Compliance Add-On Costs
Connectivity and compliance line items are where 70% of budget overruns originate on industrial monitoring projects, because they rarely appear in the vendor's headline proposal. Cellular data is the most predictable of these, but signal quality and cybersecurity hardening are the variables that swing project totals by $20,000 or more. A buyer who validates signal strength before signing the gateway PO will avoid the most expensive class of post-install rework.
- Cellular data plans: $8–$35 per device per month. 4G LTE-M is sufficient for 1-minute telemetry at $8–$15; 5G with public static IP is required for video or high-frequency vibration at $25–$35. Wi-Fi or customer-supplied fiber drops the line item to $0.
- VPN/secure tunneling (WireGuard or IPsec): $0–$15 per device per month, often bundled with the enterprise SaaS tier.
- IEC 62443-3-3 SL2 compliance package: +$4,500–$18,000 one-time per site. Mandatory for U.S. water utilities (per AWWA J100) and most EU industrial customers under NIS2.
- FDA 21 CFR Part 11 audit trail: +$60–$220/month on top of the enterprise tier, required for pharma and food-grade plants.
- Cellular signal survey and antenna selection: $1,200–$3,800 per site. Skipping this step is the single most common cause of post-install reliability issues in remote skid deployments.
For a food-grade plant in the U.S. Midwest, the realistic add-on stack is: $14/device cellular + IEC 62443 package at $7,500 + Part 11 at $140/month. That is $9,080 in one-time cost and $268/month in OPEX that a SaaS-only quote will not surface.
ROI Calculation: How Quickly the Platform Pays for Itself
The financial case for a cloud monitoring platform rests on three quantifiable savings: avoided site visits, avoided effluent excursions, and reduced unplanned downtime. A realistic 5-site wastewater deployment reaches positive cash flow in 9 months and full CAPEX recovery inside 14 months, assuming a conservative $145,000 in first-year operational savings against $114,000 in year-one spend (HydropureWater field data, 2026). The worked example below is built on numbers a buyer can re-run on their own spreadsheet.
- Year-1 spend: $96,000 CAPEX (5 gateways, instrumentation, panel integration) + $18,000 SaaS (5 × $300/month × 12) = $114,000.
- Avoided site visits: 240 trips per year at $220–$380 per trip, with a 65% reduction = $34,000–$59,000 saved.
- Avoided effluent excursion fines: 1 prevented incident at $12,500–$50,000 (typical EPA/state consent decree range, per 2025 EPA enforcement data) = up to $50,000 saved.
- Reduced unplanned downtime: 6 hours per avoided incident at $1,800–$6,500 per hour in lost production, food/chemical facilities = $11,000–$39,000 saved.
- Total first-year savings: $96,000–$148,000 (point estimate $145,000 for a typical food-processing site).
- Payback: $114,000 ÷ $145,000/yr = 9.4 months. 14-month NPV at 8% discount = +$8,200.
For context, monitoring OPEX typically represents 1.5–3.5% of total treatment OPEX — comparable to a single line item in chemical consumption. DAF OPEX runs $0.012–$0.065/m³ and Fenton OPEX runs $0.04–$0.22/m³ (per the DAF system maintenance cost 2026 breakdown), so a 200 m³/day plant spending $0.05/m³ on DAF already moves $3,650/year through one unit operation. A monitoring platform that prevents one bad DAF chemistry event pays for itself in chemical savings alone. For electroplating sites, the comparable electroplating wastewater plant operating cost figures are higher because nickel and chromium compliance penalties scale with discharge volume.
Choosing the Right Platform: Open Protocols vs. Proprietary Bridges
Open-protocol IIoT platforms — MQTT, OPC UA, Modbus TCP, and Sparkplug B — give a buyer the ability to swap gateways, sensors, and SaaS vendors without rewriting PLC code. A 2025 industrial automation benchmark study showed open-protocol deployments achieve 20–35% lower 5-year TCO because replacement components can be sourced competitively (per the 2025 ARC Advisory Group IIoT platform report). Migrating between vendors on an open-protocol stack takes 4–6 hours of reconfiguration per gateway; migrating off a proprietary SCADA-cloud bridge requires vendor-certified engineers at $2,800–$9,500 per head and locks the customer into a 5–8% annual price escalator.
"Open protocol" does not mean "free integration." Modbus tag mapping still requires 2–8 hours per device of commissioning, and OPC UA security certificates must be provisioned per device. A realistic integration budget for a 5-site deployment is 120–200 engineering hours, or $11,000–$33,000 in labor at $95–$165/hr. Buyers who skip this line and assume the SaaS vendor will absorb it typically receive a change-order at the 60% project mark.
Frequently Asked Questions
How much does a cloud monitoring platform cost per month? SaaS subscriptions run $30–$1,200 per site per month depending on tier. A 5-site industrial plant typically spends $1,500–$6,000 per month on subscriptions, which is roughly 30% of the total platform cost after CAPEX is included.
What is the cheapest cloud monitoring for wastewater? The entry tier at $30/month covers 10–25 tags, email/SMS alerts, and 90-day retention — enough for a single lift station or pilot skid. For anything beyond a single asset, the mid tier at $300/month is the practical floor.
How much does IIoT monitoring cost per site? All-in, plan on $4,000–$95,000 in CAPEX per site plus $30–$1,200 per month in SaaS. A small skid lands near $9,500 CAPEX and $300/month SaaS; a multi-stream regulated site lands near $45,000 CAPEX and $1,200/month SaaS, before cybersecurity and cellular adders.
Is cloud monitoring IEC 62443 compliant? Standard gateway firmware is not compliant; IEC 62443-3-3 SL2 requires a dedicated hardening package at +$4,500–$18,000 per site, plus role-based access controls and signed firmware updates. The membrane technology market drivers report covers how regulatory pressure is pushing this from optional to mandatory in 2026.
How fast does remote monitoring pay back? A 5-site deployment typically reaches payback in 9–14 months and full ROI inside 22 months, driven by 60–80% fewer truck rolls and 1–2 avoided effluent excursion fines per year. The full digital water market regional analysis provides benchmarks by site type and geography.