Wafer slicing wastewater treatment process design centers on a six-stage train: SiC slurry recovery, coagulant-assisted DAF, Fenton or electrochemical PEG oxidation, MBR polishing, UF/RO reuse, and plate-and-frame dewatering. Systems sized to fab influent reach COD <50 mg/L and conductivity <10 µS/cm at ≥85% recovery.
Why a Wafer Slicing Wastewater Treatment Process Needs Dedicated Design
Wafer slicing wastewater from DWS and slurry-saw lines carries SiC abrasives, PEG cutting fluid at COD 15,000–30,000 mg/L, dissolved metals, and colloidal silica. A six-stage train — slurry recovery, DAF, Fenton oxidation, MBR, UF/RO, dewatering — recovers 60–80% of SiC and reaches COD <50 mg/L at ≥85% water recovery.
Wastewater from diamond wire saw (DWS) and slurry saw cutting of mono- and multi-crystalline silicon ingots defeats municipal three-stage logic. Primary settling, activated sludge, and chlorination cannot handle SiC abrasives or PEG cutting fluid. A process engineer sizing a 2 GW wafer fab needs influent numbers and stage-by-stage removal logic, not a municipal overview.
The chemistry splits into four contaminant families. First, SiC and SiO2 abrasive particles: 5–30 µm silicon carbide from the slurry plus sub-µm colloidal silica from the kerf reaction. These abrasives are recoverable — typically 60–80% of the slurry returns to the cutting-fluid blending loop. Second, PEG or glycol cutting fluid: organic, water-miscible, and the main COD contributor at 15,000–30,000 mg/L (HydropureWater field data, 2025–2026).
Third, dissolved metal ions — Fe, Cu, Ni — come from brass-coated steel wire corrosion in the 60–80 °C cutting zone. Fourth, process cooling water and diamond wire wear debris dilute the stream but add hardness and suspended load. Each family needs its own removal stage.
Patent CN103896425A records why PEG dominates the design conversation: it dissolves easily in water, consumes little biological oxygen, is not easy to degrade in nature, and carries a COD value greatly exceeding the wastewater discharge standard. Those mass fractions match the low BOD/COD ratios we measure on diluted fab drains.
Influent Characteristics: What the Treatment System Must Handle
Raw slicing wastewater is a high-strength, abrasive, oily-organic stream that defeats most off-the-shelf WWTP designs. The table below summarizes a typical operating range observed in monocrystalline wafer fabs in 2024–2026 (HydropureWater field data, 2026):
| Parameter | Typical Influent Range | Engineering Implication |
|---|---|---|
| COD | 15,000–30,000 mg/L | Exceeds biological treatment ceiling; Fenton or electrochemical pre-treatment required |
| BOD₅ | 3,000–6,000 mg/L | BOD/COD ratio 0.15–0.25 indicates poorly biodegradable PEG chains |
| Suspended Solids (SS) | 5,000–20,000 mg/L | Predominantly SiC; abrasive, requires settling + screen pre-step |
| Oil / PEG (n-hexane extractable) | 3,000–8,000 mg/L | Drives DAF coagulant demand; floats rather than settles |
| pH | 6–9 | Neutral; Fenton stage must acidify to pH 3–4 |
| Turbidity | >10,000 NTU | Exceeds optical sensor range; colloidal silica dominates sub-µm fraction |
| Total Dissolved Solids | 1,500–4,000 mg/L | Driven by PEG, metal ions, and water-soluble glycol degradation products |
| Conductivity | 2,000–5,000 µS/cm | Pre-RO baseline; reuse target is <10 µS/cm |
Colloidal Silica Removal from Slicing Wastewater: The Sub-µm Fraction
Particle size distribution on this stream is bimodal, and the second mode is the harder problem. Settling screens and hydrocyclones recover the 5–30 µm SiC fraction efficiently. Sub-µm colloidal silica stays in stable suspension. It forms when the kerf reaction converts free silicon to SiO2, and coagulant-assisted DAF or membrane filtration is required to drop that fraction out.
Flow variability adds another design constraint. A 2 GW fab running batch slicing sees peak shifts of 1.5–2× nominal flow during ingot changeovers. Water use of 1.5–2.5 m³ per kg of sliced wafer (PV industry benchmark, 2025) means a single GW line generates 300–500 m³/day of wastewater. Equalization capacity of at least 8 hours is standard. Most plants we size for run equalization closer to 8–12 hours so the Fenton reactor never sees a double-strength slug from shift changeovers.
The 2026 Six-Stage Process Flow: Slurry Recovery to Water Reuse
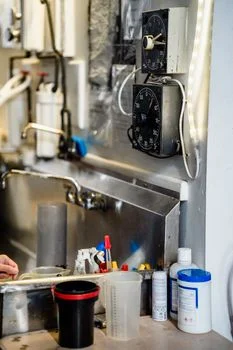
Wafer slicing wastewater treatment uses a 6-stage flow from slurry recovery to reuse water. Settlement and pre-filtration recover SiC slurry. Chemical flocculation and DAF remove suspended solids and colloidal silica. Fenton or electrochemical oxidation breaks down polyethylene glycol (PEG) cutting fluid. MBR treats residual COD. UF/RO polishes for reuse. Plate-and-frame units dewater sludge. Modern 2026 systems targeting ≥85% water recovery typically achieve effluent COD <50 mg/L and conductivity <10 µS/cm suitable for slicing reuse.
SiC Slurry Recovery Hydrocyclone DAF System: Stages 1 and 2
Stage 1 — Settling and vibrating screen. Coarse SiC is recovered via inclined plate settlers or hydrocyclones followed by a rotary bar screen for headworks solids removal. Target recovery is 60–80% of the SiC slurry, which is returned directly to the cutting-fluid blending tank. This stage alone removes the largest fraction of suspended mass and protects downstream pumps from abrasion. Ceramic-membrane recovery routes described in CN103896425A report PEG recovery ≥92% and SiC recovery above 90% under controlled slurry-saw conditions. According to the patent record, that route filters at ceramic-membrane pores below 1 µm and 0.20–0.55 MPa, delivering separated PEG at 99.7 percent purity with Si recovery up to 85%. Those figures sit above the 60–80% SiC return most DWS fabs achieve with settlers and hydrocyclones alone.
Stage 2 — Chemical conditioning and DAF. Coagulant (polyaluminum chloride, PAC, dosed at 50–150 mg/L) and flocculant (polyacrylamide, PAM, 2–5 mg/L) are added via an automatic chemical dosing system for Fenton and flocculation stages. The dose precipitates colloidal silica and bridges fine SiC particles. A HydropureWater DAF system for colloidal silica and SiC removal then floats the floc with 20–30% recycle-ratio micro-bubbles; surface loading runs 4–6 m³/m²·h and SS removal typically reaches 85–95%.
PEG Cutting Fluid Fenton Oxidation Design: Stage 3
Stage 3 — Fenton or electrochemical oxidation. H₂O₂ (30% w/w) dosed at 0.3–0.5× the COD mass, with FeSO₄·7H₂O at a H₂O₂:Fe²⁺ molar ratio of 3:1 to 5:1, pH adjusted to 3–4 with H₂SO₄, and 60–90 min HRT. Hydroxyl radicals crack PEG chains into shorter organic acids, removing 70–90% of influent COD. Electrochemical oxidation using boron-doped diamond or Ti/RuO₂ anodes is the 2026 alternative where reagent costs or sludge yield are constrained.
Stage 4 — pH neutralization and biological MBR. NaOH dosing lifts pH to 7–8, precipitating residual iron as Fe(OH)₃ sludge. A HydropureWater MBR system for residual COD and BOD polishing with submerged PVDF membranes at MLSS 8,000–12,000 mg/L and HRT 12–24 h degrades the short-chain organics left by Fenton. MBR effluent typically runs COD 200–500 mg/L and BOD <20 mg/L.
Stage 5 — UF and RO polishing. A 0.1 µm UF stage protects the RO from biomass carryover and any residual colloidal silica; see the UF vs MF comparison for RO pre-treatment for selection logic. RO operated at 70–85% recovery with an energy-recovery device on the concentrate produces reuse water at conductivity <10 µS/cm and TOC <5 mg/L — well within the purity window for cutting-fluid make-up.
Stage 6 — Sludge dewatering. Combined chemical and biological sludge is pumped to a plate-and-frame filter press for SiC-laden sludge dewatering; cake dryness ≥60% is achievable, with SiC-rich solids suitable for downstream silicon recovery or safe landfill.
Stage-by-Stage Equipment Selection and Sizing Parameters
Translating flow into equipment spec is where most vendor comparisons fall apart. The table below consolidates the engineering ranges a procurement engineer can use for a 500 m³/day wafer fab (HydropureWater engineering reference, 2026):
| Stage | Equipment | Capacity / Loading | Key Sizing Parameter | Removal Efficiency |
|---|---|---|---|---|
| 1 — Headworks | Rotary bar screen + hydrocyclone | 10–200 m³/h | Screen aperture 0.5–1.0 mm | 60–80% SiC recovery |
| 2 — DAF | DAF | 4–300 m³/h per unit | Surface loading 4–6 m/h; recycle 20–30% | 85–95% SS; 60–80% colloidal SiO2 |
| 3 — Fenton | Stirred reactor + post-neutralization | HRT 60–90 min | H₂O₂:Fe²⁺ 3:1–5:1; pH 3–4 | 70–90% COD |
| 4 — MBR | DF series PVDF flat-sheet MBR modules | Flux 12–18 LMH | MLSS 8,000–12,000 mg/L; HRT 12–24 h | 90–95% residual BOD |
| 5 — UF + RO | HydropureWater industrial RO for water reuse polishing | Recovery 70–85% | Antiscalant mandatory; ERD on concentrate | >99% TDS rejection |
| 6 — Sludge | Plate-and-frame filter press | 5–25 kg DS/m²·h | Chamber volume sized to daily solids | Cake dryness ≥60% |
Two practical notes apply on this stream. First, DAF sizing must account for the PEG fraction, which floats rather than settles. Surface loading rates developed for oily wastewater (typically 5–10 m/h) drop to 4–6 m/h when PEG is present because the floc blanket carries more bound water. Second, RO recovery above 70% on this stream demands antiscalant dosing (typically 2–5 mg/L of a phosphonate-based inhibitor). SiO2 saturation in the concentrate will foul the membrane within weeks if left uncontrolled.
For a deeper look at why MBR beats conventional activated sludge on this stream, the MBR vs conventional activated sludge comparison is worth reading. For the front end, the DAF vs oil-water separator comparison explains when DAF earns its capex over a simpler CPI separator.
Selection checklist before freezing the P&ID:
- Confirm SiC particle-size split (5–30 µm vs sub-µm colloidal) from a recent PSD sample.
- Measure BOD/COD; ratios below 0.25 lock in Fenton or electrochemical oxidation upstream of biology.
- Size equalization for ≥8 h at peak shift flow (1.5–2× nominal).
- Set DAF surface loading at 4–6 m/h when PEG is present, not the 5–10 m/h oily-water default.
- Budget antiscalant (2–5 mg/L) and an ERD whenever RO recovery exceeds 70%.
- Specify plate-and-frame dewatering for SiC-rich sludge; belt media abrades within weeks.
- Decide reuse vs discharge using local water price, power tariff, and the consent COD limit.
How the Wafer Slicing Process Sets Reuse Versus Discharge
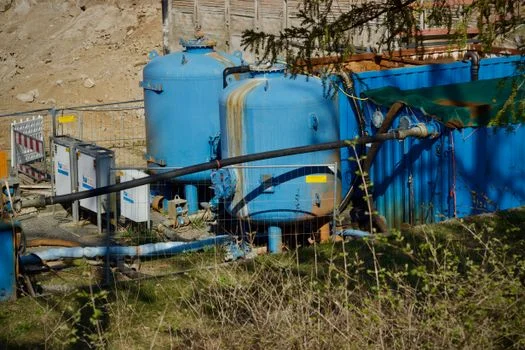
The decision between full RO reuse and Fenton + MBR discharge depends on local water cost, electricity cost, and the applicable effluent standard. Earlier materials sometimes cited China GB 30485-2013 for COD <500 mg/L and SS <400 mg/L on solar wafer lines. GB 30485-2013 is the standard for pollution control on co-processing of solid wastes in cement kilns, not a wafer effluent standard (Ministry of Environmental Protection, 2013). Many Chinese plants still use COD <500 mg/L and SS <400 mg/L as indirect-discharge pretreatment ceilings when connecting to a park or municipal works. A well-run Fenton + MBR train can meet those ceilings. The design basis must follow the plant permit and the applicable industrial or local limit, not GB 30485-2013.
EU industrial discharge typically requires COD <160 mg/L at the boundary. Taiwan's Effluent Standards, amended 18 December 2024, carry a dedicated table for the wafer and semiconductor manufacturing industry. Taiwan's standalone Wafer and Semiconductor Manufacturing Industry Effluent Standards, promulgated on 1 December 2011, were abolished on 25 December 2017. According to the Ministry of Environment's English law record, they applied to wafer and semiconductor manufacturing enterprises regulated under the Water Pollution Control Act classification, with Article 4 pointing to attached table 1 for the water quality items and limits. Earlier project notes often used COD in the 100–200 mg/L band depending on receiving water. Confirm the current Table 1 values before locking design — see the 2026 global COD and BOD discharge limit standards for region-by-region numbers.
Silicon DWS lines differ from compound-semiconductor drains. For GaN lines see gan wafer sawing water discharge contents and the related GaN wastewater ZLD engineering specs and gallium recovery cost breakdown. The reuse case builds on three economic drivers:
| Driver | Discharge Path (Fenton + MBR only) | Reuse Path (Fenton + MBR + UF/RO) |
|---|---|---|
| Water savings | 0 m³/kg wafer reused | 1.5–2.5 m³/kg wafer × water cost $1.5–3.0/m³ |
| PEG recovery credit | 0 (oxidized to CO₂) | Partial recovery upstream; 2026 spot price $1,200–1,800/ton |
| Power demand | 0.8–1.2 kWh/m³ | 2.5–4.0 kWh/m³ (RO + ERD) |
| CAPEX (500 m³/day) | $0.8–1.2 M | $1.8–2.6 M |
| OPEX ($/m³ treated) | $0.6–1.0 | $1.2–1.8 |
| Payback vs discharge | Baseline | 18–30 months in water-scarce regions |
| Concentrate disposal | n/a | High-TDS brine to evaporation pond or crystallizer |
Decision rule of thumb: in regions where industrial water cost exceeds $2.00/m³ and electricity is below $0.08/kWh, full RO reuse pays back inside two years. Where water is cheap and discharge limits are loose, Fenton + MBR is the rational minimum. The concentrate stream is a real liability — treat it as high-TDS brine requiring evaporation or crystallization. Budget for a crystallizer or lined evaporation pond if the local geology will not accept brine injection.
Campus domestic sewage from offices and canteens is a separate low-strength stream. An Underground Package Sewage Treatment Plant (WSZ Series) can handle that sanitary load without mixing it into the abrasive slicing train.
Field Scenario: 2 GW Wafer Fab Treatment Retrofit (2025 Case)
A 2 GW monocrystalline wafer fab in eastern China generated roughly 600 m³/day of slicing wastewater from 12 parallel DWS lines. The plant retrofitted a legacy concrete settling basin into the full six-stage train in 2025. Before retrofit the plant recovered only 25% of SiC slurry through manual screen skimming, neutralized with NaOH, and discharged directly. Consent violations for COD arrived roughly every other month during peak shift loads.
After commissioning the Fenton/DAF/MBR/RO train, the plant reports 82% water reuse and 70% PEG + SiC recovery back to the cutting-fluid loop. Dewatered chemical sludge runs about 6.5 tons/day at 65% moisture on a plate-and-frame filter press for SiC-laden sludge dewatering. As reported in the 2025 industry retrofit, payback landed at 22 months once PEG recovery credit and avoided discharge penalties were included. The case is representative — not unique — and the same train scales linearly to 1 GW and 5 GW fabs with parallel equipment trains rather than larger unit sizes.
Who This Is For and Next Step
Plant engineers, EPC contractors, and procurement managers sizing treatment for silicon DWS or slurry-saw wafer lines in the 300–600 m³/day class will find the ranges above usable for bid packages. Teams working only on GaN or compound-semiconductor drains should start from the GaN pages linked above rather than this silicon train. If you have influent COD, SS, and flow data for a retrofit or greenfield line, request a wafer-fab treatment sizing review with those numbers attached.
Frequently Asked Questions
What is the most difficult pollutant to remove from wafer slicing wastewater?
Colloidal silica in synergy with PEG is the hardest pair on this stream. The sub-µm SiO2 particles are stabilized by adsorbed glycol and do not settle or float without coagulant assistance. Fenton oxidation of PEG must come before — or be paired with — DAF for the colloidal silica to drop out reliably on high-strength slicing drains at 15,000–30,000 mg/L COD.
Can wafer slicing wastewater be reused in cutting fluid blending?
Yes. After UF + RO polishing the conductivity drops below 10 µS/cm and TOC below 5 mg/L, which sits inside the purity window for PEG make-up water. Reuse at 80%+ recovery is standard in 2026 retrofits when antiscalant dosing and concentrate disposal are budgeted correctly from day one.
Is Fenton oxidation mandatory or can MBR handle the COD?
MBR alone struggles above 10,000 mg/L influent COD. The biology is overloaded and foaming from PEG is severe under those loads. Fenton, ozone, or electrochemical pre-treatment is mandatory for raw strengths in the 15,000–30,000 mg/L range measured on undiluted slurry drains.
What does diamond wire saw wastewater COD treatment involve?
Diamond wire saw wastewater COD treatment combines Fenton or electrochemical oxidation with downstream MBR polishing, because DWS drains run drier and more concentrated than slurry-saw flows. Undiluted DWS COD typically lands in the 15,000–30,000 mg/L band. Fenton removes 70–90% of that load, and MBR then takes effluent COD to 200–500 mg/L before UF/RO reuse polishing.
How much water does a 1 GW wafer fab use per day?
Typically 300–500 m³/day of slicing wastewater, depending on ingot size, cutting yield, and whether diamond wire saw or slurry saw is dominant. Diamond wire saws run drier than slurry saws. That shifts the ratio toward lower flow with higher concentration on the same wafer output.
What sludge dewatering option fits SiC-rich chemical sludge?
Plate-and-frame filter press is preferred over belt press because the abrasive SiC particles cut and wear belt-filter media within weeks. Centrifuge dewatering is feasible on this sludge. Cake dryness rarely exceeds 35%, which makes downstream disposal more expensive per ton of solids.