What Defines an Ultrafiltration System vs a Microfiltration System
Ultrafiltration (UF) systems use membranes with 0.01–0.1 μm nominal pores and 1,000–500,000 Dalton molecular weight cutoffs, removing viruses, colloids, and most macromolecules at 0.5–5 bar transmembrane pressure. Microfiltration (MF) systems use 0.1–10 μm pores to remove suspended solids, bacteria, and turbidity at lower 0.1–2 bar TMP. Choose MF for TSS and turbidity polishing; choose UF when downstream RO membrane protection, virus log reduction, or reuse-grade (<1 NTU) effluent is required.
The single most important separator is pore size, and the gap between the two technologies is roughly one order of magnitude: 0.1 μm marks both the upper bound of UF and the lower bound of MF. That 10× ratio is what determines everything downstream — what each membrane rejects, what TMP it runs at, and whether it qualifies as a RO pretreatment barrier or only a clarifier replacement. In practical engineering terms, MF behaves like a very fine multimedia filter with backwash; UF behaves like a barrier membrane that produces RO-grade feed water.
Operating mode is the second differentiator. MF is almost always run dead-end at low TMP, which is why its specific energy demand is typically 0.05–0.20 kWh/m³. UF is increasingly run in tangential or cross-flow mode — sometimes single-pass tangential flow filtration (SPTFF) at the high end — to control the fouling layer that forms on tighter pores, lifting specific energy to 0.2–0.6 kWh/m³. The Scientific Reports study on UF for chromium removal from potable water (13k accesses) confirms UF's role as a barrier membrane, not just a polishing step — it retained both particulate and dissolved-phase metals that MF would not have stopped.
For the specifier, the practical translation is this: if your P&ID needs a TSS/turbidity guard before discharge, draw MF on the line. If it needs an SDI <3, virus log, or RO-feed barrier, draw UF. The two membranes are not substitutes — they are sequential in most real trains, and that framing is what separates a defensible 2026 specification from a 2015-era "either/or" line item.
How Pore Size Translates to Real Removal Performance
MF at 0.1–10 μm removes suspended solids, turbidity, and most bacteria, delivering 90–99% TSS removal and effluent turbidity typically below 1 NTU when paired with a multimedia filter upstream. UF at 0.01–0.1 μm adds removal of colloids, high-molecular-weight organics, proteins, and viruses — typically achieving 4-log virus reduction and SDI <3 on the permeate, which is the standard RO-feed benchmark. The performance jump from MF to UF is not incremental; it is the difference between a polishing step and a true barrier.
The HydropureWater MBR specification is a useful class boundary: a 0.1 μm PVDF submerged membrane producing effluent with particle counts below 1 μm. That membrane sits at the upper edge of UF, and its effluent qualifies as RO feed in most reuse trains. Below it, true UF at 0.01–0.05 μm delivers 6-log bacteria reduction and reliable virus log, which is why pharmaceutical and food-and-beverage reuse loops standardize on tighter UF rather than MF.
One point engineers get wrong in vendor meetings: the difference between "absolute" and "nominal" pore ratings. UF membranes are rated absolute — a 0.01 μm UF membrane will not pass a 0.02 μm particle under standard test conditions. MF membranes, especially in the 0.1–1 μm range, are often rated nominal, meaning some fraction of sub-rated particles will pass. If your discharge or reuse permit is tight on particle counts, nominal MF will not get you there — absolute UF is the only defensible choice.
| Parameter | MF (0.1–10 μm) | UF (0.01–0.1 μm) |
|---|---|---|
| TSS removal | 90–99% | >99% |
| Effluent turbidity | <1 NTU | <0.1 NTU |
| Bacteria log reduction | 3–4 log | 5–6 log |
| Virus log reduction | 0–1 log | 3–4 log (MS2 bacteriophage) |
| SDI of permeate | SDI 3–5 | SDI <3 (RO feed class) |
| Pore rating basis | Often nominal | Absolute |
Membrane Materials, Module Formats, and Operating Parameters
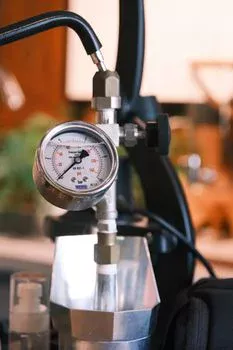
PVDF dominates UF hollow-fiber and MBR flat-sheet modules because it tolerates 500–1,000 mg/L free chlorine during CIP — a practical advantage when feeds carry biological fouling or when CIP frequency is high. The HydropureWater DF series PVDF flat sheet module is a representative example, rated for MBR duty with typical aeration demand of 0.1–0.3 m³ air/m³ permeate per scour cycle. PES (polyethersulfone) delivers higher flux than PVDF in many UF applications — often 20–30% higher at the same TMP — but its chlorine tolerance is roughly an order of magnitude lower, typically 50–200 mg/L NaOCl exposure, which constrains CIP chemistry and frequency.
Ceramic UF — alpha-alumina, titania, ZrO₂ — sits in a different category. Pore sizes run from 0.01 μm UF down to nanofiltration territory, and modules tolerate pH 0–14, temperatures above 90 °C, and pressures above 10 bar. The Jiuwu ceramic membrane brine filtration line is the canonical industrial reference, and ceramic is the only UF class that handles produced water, hot brine, and aggressive chemical cleaning without polymer degradation. For most municipal and light-industrial reuse, polymer UF remains the cost default; for high-temperature or high-TDS feeds, ceramic earns its 3–5× CAPEX premium.
Module format follows feedwater chemistry. Hollow fiber dominates UF because of its high packing density (up to 1,500 m²/m³) and backwash capability. Flat sheet is standard in MBR because of its air-scour tolerance and ease of cassette replacement. Tubular UF (10–25 mm inner diameter) is reserved for feeds with high TSS or oil — typically above 500 mg/L TSS — where hollow fiber would plug. MF is most often supplied as pleated cartridge or hollow fiber, with tubular MF appearing in food and fermentation broth clarification.
| Operating parameter | MF | UF (submerged MBR) | UF (cross-flow / ceramic) |
|---|---|---|---|
| Flux range | 50–200 LMH | 10–25 LMH | 20–80 LMH (polymer); 50–150 LMH (ceramic) |
| TMP range | 0.1–2 bar | 0.1–0.5 bar | 0.5–5 bar |
| Backwash interval | 30–60 min | 15–45 min | 30–120 min |
| Recovery | 95–99% | 90–98% | 85–95% (polymer); 90–98% (ceramic) |
| Typical material | PP, PVDF, PES | PVDF flat sheet | PES, PVDF (polymer); Al₂O₃, ZrO₂ (ceramic) |
Head-to-Head Comparison: UF vs MF at a Glance
One table, ten rows, all the decision parameters on a single screen. This is the specifier's reference card.
| Parameter | Microfiltration (MF) | Ultrafiltration (UF) |
|---|---|---|
| Nominal pore size | 0.1–10 μm | 0.01–0.1 μm |
| MWCO | Not applicable (>500 kDa) | 1,000–500,000 Da (1–500 kDa) |
| TMP range | 0.1–2 bar | 0.5–5 bar |
| Flux range | 50–200 LMH | 20–80 LMH (submerged MBR: 10–25 LMH) |
| TSS removal | 90–99% | >99% |
| Effluent turbidity | <1 NTU | <0.1 NTU |
| Virus log reduction | 0–1 log | 3–4 log (MS2) |
| SDI of permeate | 3–5 | <3 |
| Typical materials | PP, PVDF, PES, ceramic | PVDF, PES, ceramic (Al₂O₃, ZrO₂) |
| CAPEX (industrial skid-mount, 2026 indicative) | $80–$300 per m³-day installed | $150–$500 per m³-day installed |
| OPEX (energy + chemicals + membrane replacement) | $0.02–$0.08 per m³ | $0.05–$0.18 per m³ |
| Specific energy | 0.05–0.20 kWh/m³ | 0.20–0.60 kWh/m³ |
CAPEX ranges are industrial skid-mount, 50–500 m³/day capacity, 2026 indicative. OPEX covers energy at $0.08–$0.12/kWh, CEB/CIP chemicals, and amortized membrane replacement over 5–7 years. The UF premium is real — roughly 1.5–2× MF on CAPEX and 2× on OPEX — but the downstream industrial RO system recovery of 70–95% on UF-grade feed typically pays it back inside 24–36 months for any reuse project with a water cost above $1.50/m³. For a process engineer defending a $200,000 line item in a budget meeting, that payback math is the closing argument.
The MF → UF → RO Process Train: Why 2026 Specs Use Both
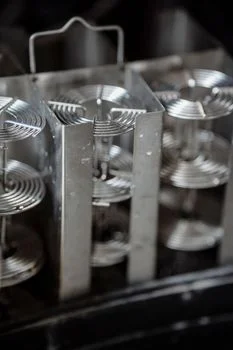
In real plants, UF rarely replaces MF. Instead, MF protects UF, and UF protects RO. Reframing the choice from "UF or MF" to "where in the train does each sit" is what separates a defensible specification from a line-item error.
Stage 1 — MF or MBR. A multimedia filter plus MF, or a submerged MBR membrane, lifts influent TSS from 100–500 mg/L down to below 30 mg/L and turbidity from 50–200 NTU to below 1 NTU. That work protects UF from rapid fouling and typically doubles UF flux relative to a feed that arrives unpolished. The HydropureWater DAF machine handles the oil and floatable load upstream; the MBR membrane bioreactor then merges biological BOD removal with UF-class solids separation in one tank, which is why most 2026 greenfield reuse designs skip a standalone MF stage when MBR is already specified.
Stage 2 — UF. UF takes the MBR or MF effluent and pushes SDI below 3, turbidity below 0.1 NTU, and achieves 4-log virus reduction. That permeate is the only feed class that lets a RO membrane run at 80–95% recovery without accelerated fouling. If your P&ID is missing this stage and your RO is fed by MF or multimedia filter effluent alone, expect RO CIP frequency to rise from monthly to weekly, with a 2–3× lift in normalized OPEX — the math kills the apparent savings of skipping UF within the first year.
Stage 3 — RO. The industrial RO system achieves 70–95% recovery for industrial reuse, polishing the UF permeate to below 50 µS/cm and producing the boiler-feed, cooling-tower, or process-water quality that closes the reuse loop. For a deeper dive on supplier selection, the UF supplier buyer's guide for Mexico covers regional pricing and lead times that affect CAPEX timing.
The hybrid train — DAF → MBR → cartridge → RO, or MMF → UF → RO in a non-biological application — is the default 2026 specification for any project above 100 m³/day with a reuse target. Engineers who still draw "MF or UF" as an either/or decision on the P&ID are specifying a 2015 plant.
When to Specify MF, When to Specify UF, and When to Specify Both
Three rules, in priority order:
- Specify MF alone when the goal is TSS and turbidity polishing for discharge to sewer or surface water, with no reuse target and no RO downstream. Industrial examples: textile effluent clarification, food processing pre-screening, or as a guard on a cooling-tower side-stream. Use a multimedia filter upstream and a pleated or hollow-fiber MF module at 50–200 LMH.
- Specify UF when (a) RO is downstream, (b) water reuse is a project requirement, (c) virus or pathogen log reduction is a regulatory target, or (d) feedwater contains emulsified oils or high-molecular-weight organics. The HydropureWater multi-media filter serves as the upstream guard for either membrane class. For a project that touches any of these four conditions, MF is not a substitute.
- Specify both (MF then UF) when feedwater TSS exceeds 200 mg/L, or when RO recovery above 80% is targeted. The MF stage protects UF flux, extends membrane life by 30–50%, and prevents the backwash cycle on the UF from collapsing under solids shock loads. This is the typical 2026 industrial reuse spec: MMF → MF → UF → RO at 80–95% recovery. For high-TDS feeds above 5,000 mg/L, the high-TDS treatment guide walks through where MF drops out and tighter membrane steps take over.
Frequently Asked Questions
What is the pore size difference between ultrafiltration and microfiltration?
UF has nominal pores of 0.01–0.1 μm; MF has nominal pores of 0.1–10 μm, a 10× range difference. UF is rated absolute; MF is often rated nominal and may pass a fraction of sub-rated particles, which matters for any permit that specifies particle counts.
What does MWCO mean for ultrafiltration membranes?
Molecular weight cutoff (MWCO) is the Dalton rating at which the membrane rejects 90% of a test solute; UF spans 1,000–500,000 Da. The Sigma-Aldrich TFF portfolio anchors 10–100 kDa MWCO as the standard protein-fractionation range, and the same MWCO logic applies to industrial UF selection for organic and colloid rejection.
Can microfiltration replace ultrafiltration for RO pretreatment?
MF alone rarely meets the SDI <3 RO-feed benchmark; it typically delivers SDI 3–5 with no virus log. UF is the standard RO pretreatment barrier because it produces SDI <3, virus log reduction, and absolute pore ratings that protect RO from fouling and biofilm formation, the core of an industrial UF vs MF system decision.
What is the cost difference between UF and MF systems?
Industrial skid-mount CAPEX runs $80–$300 per m³-day for MF and $150–$500 per m³-day for UF; OPEX runs $0.02–$0.08 per m³ for MF and $0.05–$0.18 per m³ for UF, driven by higher TMP energy and CEB/CIP chemical use. The UF premium is typically recovered in 24–36 months on reuse projects with water cost above $1.50/m³, which is why 2026 industrial reuse specifications choose UF when RO is downstream.
Related Equipment
- DF series PVDF flat sheet module — specifications, capacity range, and technical data