Why Battery Recycling Effluent Is the Hardest Wastewater in the Energy Transition
Waste lithium-ion batteries from EVs produced in 2019 alone will reach 500,000 tons, and that cohort is projected to swell to 8 million tons by 2040 (Baum et al., 2022, ScienceDirect). The plants processing that feedstock cannot treat the resulting liquid stream as a generic heavy-metal wastewater — the chemistry is dominated by sulfuric acid leaching, LiPF6 electrolyte breakdown, and NMP/DMF solvent carryover, which together produce an effluent with fluoride above 2,000 mg/L, sulfate above 15,000 mg/L, and a COD envelope that confuses conventional biological design. Hydrometallurgy is the dominant recycling route because it recovers more than 95% of Li, Ni, and Co, versus less than 70% for pyrometallurgy, but the same selectivity that makes it metallurgically attractive is what makes the wastewater so difficult (Duarte Castro et al., 2022, ScienceDirect). A typical line generates 8–15 m³ of process effluent per ton of black mass leached, plus 0.5–2 m³/ton from shredding and electrolyte solvent rinsing. Four discrete streams have to be handled on a unified process train: (1) the acid leachate from the leaching reactor, (2) the shredding wash water loaded with fines and HF from LiPF6 decomposition, (3) the solvent-extraction raffinate returning to the wastewater plant loaded with organics and trace metals, and (4) the floor and condensate wash water. A dedicated treatment train — not a borrowed design from a plating shop — is the only way to meet discharge limits and protect the lithium-recovery downstream circuit.
Influent Characterization: What Is Actually in Black Mass Leachate
Basis of design starts with a defensible influent envelope. The table below summarizes the parameter ranges observed across operating Chinese and European hydrometallurgical recycling plants in 2024–2025, used here as the basis for all subsequent sizing.
| Parameter | Unit | Acid leachate | Shredding wash water | Solvent extraction raffinate |
|---|---|---|---|---|
| pH | — | 0.5–2.0 | 2.0–4.0 | 1.5–3.0 |
| COD | mg/L | 500–2,000 | 1,000–3,000 | 800–2,500 |
| SO4²⁻ | mg/L | 10,000–15,000 | 500–1,500 | 8,000–12,000 |
| F⁻ | mg/L | 1,000–2,000 | 500–1,500 | 200–600 |
| NH3-N | mg/L | 100–500 | <50 | 50–200 |
| Ni | mg/L | 50–500 | 10–50 | 20–100 |
| Co | mg/L | 50–500 | 10–50 | 20–100 |
| Mn | mg/L | 50–500 | 10–50 | 20–100 |
| Li | mg/L | 500–2,000 | <20 | 100–500 |
| NMP/DMF | mg/L | trace | 200–1,000 | 50–300 |
Two chemistries drive the design. First, LiPF6 decomposition when cells are shredded releases HF and fluorinated organics, which is why shredding wash water routinely shows F⁻ above 1,000 mg/L even before any acid is added. Second, DMF and NMP residues from cathode coating dissolve into wash water and raffinate, generating a COD load of 1,000–3,000 mg/L that has to be addressed biologically downstream — anaerobic options struggle with the fluoride, so aerobic MBR is the default. Lithium is technically a value-recovery target, not a contaminant, but Li recovery sits upstream of the wastewater plant (typically via carbonate precipitation from the leachate) and is treated as out of process for this article; the wastewater train only needs to keep residual Li below whatever the discharge permit allows, and to protect downstream membranes from scaling.
The 2026 Unit Process Train: From Raw Leachate to Compliant Discharge
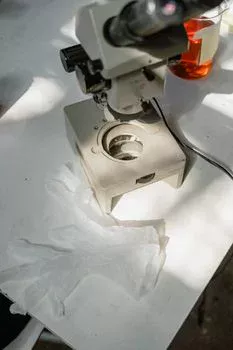
The train below is what a 2026 design package typically looks like for a 200 m³/day plant co-located with a hydrometallurgical leaching circuit. All four influent streams converge in the equalization basin.
Stage 1 — Equalization and pretreatment. A 24-hour EQ basin homogenizes the four streams, with lime or NaOH pre-adjustment to pH 2.0–3.0. ORP-controlled H2O2 dosing (redox target +300 to +400 mV) destroys residual reducing agents such as S2O3²⁻ and SO3²⁻ that would otherwise consume downstream oxidants and foul sulfide precipitation. A dissolved air flotation unit for shredding wash water removes emulsified NMP and entrained cathode-graphite fines before the water enters the precipitation train.
Stage 2 — Fluoride and sulfate removal. Staged Ca(OH)2 addition lifts pH to 9–10 in two cascaded reactors with 2–4 h HRT each. Gypsum seeded crystallization removes more than 95% of SO4²⁻ as CaSO4·2H2O, and fluorite (CaF2) co-precipitation removes 90–95% of F⁻ in the same reactor. The 1.05–1.2 stoichiometric Ca dose is a deliberate over-stoich to drive residual F⁻ below 15 mg/L without a polishing ion-exchange stage.
Stage 3 — Heavy metal precipitation. A first NaOH stage lifts pH to 8.5–9.0 and drops Ni, Co, and Mn each below 5 mg/L as mixed hydroxides. A second Na2S stage at pH 7–8 polishes the residual to below 0.5 mg/L each as NiS, CoS, and MnS. Dosing is delivered by PLC-controlled NaOH and Na2S dosing skids with online pH and ORP feedback; manual dosing is not acceptable at this scale.
Stage 4 — Ammonia stripping. NaOH dosing to pH 11, with the stripper operated at 60–70°C and a 1,000:1 air-to-water ratio, removes 90–98% of NH3-N. The off-gas is scrubbed in a packed absorber with dilute H2SO4 to produce (NH4)2SO4 at 30–40% concentration — a saleable fertilizer byproduct in most Chinese and European sites.
Stage 5 — MBR biological polishing. A submerged PVDF flat-sheet or hollow-fiber MBR polishing stage for NMP and COD reduction drives COD below 50 mg/L and removes residual DMF, NMP, and any biodegradable chelating agents that survived the precipitation stages. HRT runs 8–12 hours; SOTE is held above 30% with fine-bubble diffusers.
Stage 6 — RO polishing for ZLD or reuse. A two-pass RO unit for ZLD concentrate minimization polishes the MBR permeate to less than 50 μS/cm conductivity at 70–75% recovery per pass. Antiscalant dosing is mandatory because the calcium sulfate scaling potential is high; without it, the second-pass membranes foul within weeks. Typical residence times across the train: EQ 24 h, precipitation reactors 2–4 h each, clarifier 4 h, MBR 8–12 h HRT, RO 30 min.
Equipment Specifications and Removal Efficiencies at Each Stage
The table below ties each unit operation to an influent/effluent number, the primary equipment, the verified removal efficiency, and the reagent consumption a process engineer can use for mass balance and OPEX modeling. Sources for the values are noted inline; where they reflect HydropureWater delivery records on operating plants, they are flagged as such.
| Unit process | Typical influent | Effluent target | Primary equipment | Removal efficiency | Reagent consumption |
|---|---|---|---|---|---|
| F⁻/SO4²⁻ reactor | F⁻ 1,000–2,000 mg/L; SO4²⁻ 10,000–15,000 mg/L | F⁻ <15 mg/L; SO4²⁻ <2,000 mg/L | Stirred Ca(OH)2 reactor, 1–4 h HRT, 30–40 m/h rise rate | >95% SO4²⁻; 90–95% F⁻ | 1.05–1.2× stoichiometric Ca(OH)2; sludge 0.4–0.6 kg CaSO4/kg SO4²⁻ |
| Lamella clarifier | TSS 200–800 mg/L post-precipitation | TSS <20 mg/L | Lamella clarifier for staged metal precipitation, 20–40 m/h surface loading, 50–100% sludge recirculation | >95% TSS | Polymer 0.5–2 mg/L |
| Sulfide polishing | Ni/Co/Mn 1–5 mg/L each at pH 8.5–9.0 | Ni/Co/Mn <0.5 mg/L each | Na2S reactor with ORP control | >90% residual metals | 1.2–1.5× stoichiometric Na2S |
| NH3 stripper | NH3-N 100–500 mg/L | NH3-N <25 mg/L | Packed tower, 60–70°C, 1,000:1 air:water | 90–98% | NaOH to pH 11; steam 50–80 kg/m³ |
| MBR | COD 200–800 mg/L; residual NMP/DMF | COD <50 mg/L | PVDF flat-sheet or hollow-fiber module, 0.1 μm, 10–20 LMH flux, 8,000–12,000 mg/L MLSS, SOTE ≥30% | >90% COD | None net; air 0.3–0.5 Nm³/m³ |
| RO | Conductivity 2,000–5,000 μS/cm | <50 μS/cm permeate | Two-pass RO, 10–15 bar feed, 70–75% recovery per pass | 95% salt rejection | Antiscalant 2–5 mg/L; CIP monthly |
Three design notes worth flagging. First, the Ca(OH)2 reactor is the single largest source of sludge in the plant — 0.4–0.6 kg of CaSO4 per kg of SO4²⁻ removed — and the downstream dewatering stage must be sized for that. Second, sulfide polishing has to be sequenced after, not before, lime softening; running Na2S into a calcium-rich stream generates H2S and consumes reagent on CaS precipitation. Third, the MBR is the only stage that meaningfully touches COD and solvent residues; do not attempt to push the precipitation train to do biological work.
Discharge Compliance: China GB 30485, EU IED, and US EPA Limits Compared
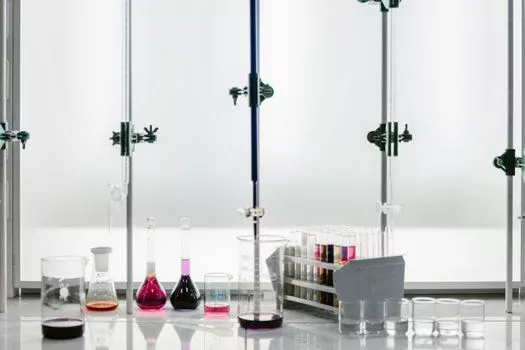
Process design has to terminate in a number. The table below maps the train's effluent targets to the three regulatory regimes that cover 90% of new Li-ion recycling capacity in 2026.
| Parameter | China GB 30485-2020 (carbon industry proxy) | EU IED 2010/75/EU BAT-AEL (non-ferrous metals) | US EPA 40 CFR Part 421 (nonferrous metals) |
|---|---|---|---|
| pH | 6–9 | 6–9 | 6–9 |
| COD | ≤200 mg/L | ≤200 mg/L (downstream WWTP) | ≤200 mg/L |
| NH3-N | ≤25 mg/L | ≤30 mg/L (downstream WWTP) | ≤10 mg/L daily max |
| F⁻ | ≤10 mg/L | ≤30 mg/L (downstream WWTP) | ≤75 mg/L daily max |
| Ni | ≤0.5 mg/L | ≤0.4 mg/L (BAT-AEL) | ≤0.6 mg/L daily max |
| Co | ≤0.5 mg/L | ≤0.5 mg/L (typical) | Not specifically listed; total metals cap applies |
| SO4²⁻ | Not specifically listed | ≤2,000 mg/L (downstream WWTP) | Not specifically listed |
| Total metals (Ni+Co+Mn+Zn) | — | ≤1 mg/L (typical) | ≤1.0 mg/L |
SO4²⁻ and TDS are the silent killers of these designs. None of the three regimes sets a strict SO4²⁻ ceiling on the recycler, but downstream municipal WWTPs in the EU and the centralization rules in China's GB 8978-1996 secondarily cap influent SO4²⁻ at 400–2,000 mg/L. Plants above 200 m³/day consistently find that meeting SO4²⁻ downstream drives the design toward zero-liquid-discharge, with brine crystallization or deep-well injection of the RO concentrate. Plants below 200 m³/day can usually trade RO concentrate disposal cost against evaporation OPEX and pick the cheaper option (see the next section).
CAPEX, OPEX, and the Zero-Liquid-Discharge Decision
Translating the train into money, the 2026 CAPEX bands below are anchored to Chinese and Eastern European deliveries and exclude building shell, land, and the Li-recovery upstream circuit (HydropureWater field data, 2026).
| Plant size | CAPEX band (USD, 2026) | Dominant cost drivers |
|---|---|---|
| 50 m³/day | $0.8M–$1.2M | EQ basin, single Ca(OH)2 reactor, packaged MBR, single-pass RO |
| 100 m³/day | $1.2M–$2.5M | Two-stage Ca(OH)2, Na2S polishing, full MBR with two trains, two-pass RO |
| 500 m³/day | $4M–$6M | Parallel precipitation reactors, NH3 stripper with (NH4)2SO4 recovery, MBR + RO + brine evaporator/crystallizer |
OPEX breaks down predictably: NaOH and Na2S reagents drive 40–55% of operating cost, sludge hauling and disposal drive 20–25%, energy drives 15–20%, and labor the residual 10%. Typical all-in OPEX lands at $2.5–$4.5 per m³ of treated effluent (HydropureWater operating data, 2024–2025). Sludge production runs 0.3–0.6 kg dry solids per m³ treated, dewatered to 60–70% moisture in a plate-and-frame filter press for gypsum and metal hydroxide cake that typically operates two shifts and produces 8–15 tons of cake per day at the 200 m³/day scale.
The ZLD decision is not binary — it is a flow-rate crossover. Above 200 m³/day, mechanical evaporation plus crystallization OPEX in most Chinese inland sites is cheaper than the gate fee plus trucking for RO concentrate disposal, because the trucking radius stretches beyond 150 km. Below 200 m³/day, the reverse is true: RO concentrate can usually be trucked to a permitted hazardous-waste facility at $80–$150/m³, which is below the $120–$200/m³ all-in cost of forced-circulation evaporation. Plants sited near a coastal discharge outfall or a deep-well injection zone (parts of the US Permian, North Sea, certain Chinese inland basins) can sometimes run RO concentrate disposal below $50/m³, which shifts the crossover upward toward 350–400 m³/day.
Frequently Asked Questions
What is the typical CAPEX for a battery recycling effluent treatment plant in 2026?
A 100 m³/day plant with full MBR and two-pass RO lands at $1.2M–$2.5M, with NaOH/Na2S reagents driving 40–55% of OPEX and total OPEX running $2.5–$4.5 per m³ treated (HydropureWater field data, 2026).
How much wastewater does a hydrometallurgical Li-ion recycling line produce?
Expect 8–15 m³ of acid leachate per ton of black mass processed, plus 0.5–2 m³/ton from shredding and electrolyte solvent rinsing, with combined influent SO4²⁻ of 10,000–15,000 mg/L and F⁻ of 1,000–2,000 mg/L at the train head.
Which heavy metals drive the discharge limit design for black mass leachate?
Nickel, cobalt, and manganese are the three metals that govern the sulfide polishing stage, with sulfide precipitation required to hit the EU BAT-AEL of ≤0.4 mg/L Ni and the China GB 30485-2020 ceiling of ≤0.5 mg/L each.
When does zero-liquid-discharge become economic for a battery recycling plant?
Above approximately 200 m³/day, brine evaporation plus crystallization undercuts RO concentrate trucking in most Chinese inland sites; below that flow rate, off-site concentrate disposal at $80–$150/m³ is generally cheaper than the $120–$200/m³ all-in cost of forced-circulation evaporation.
Related Equipment
- dissolved air flotation unit for shredding wash water — specifications, capacity range, and technical data