A 1 GW crystalline silicon solar cell fab generates 50–100 m³/h of wastewater containing 500–1,500 mg/L fluoride, 100–300 mg/L COD, and 50–200 mg/L suspended solids. Hybrid DAF-RO-MBR systems achieve more than 99% fluoride removal and 95–99% TSS and COD reduction, meeting China’s GB 8978-1996 discharge limits of fluoride ≤10 mg/L and COD ≤100 mg/L. The solar cell wastewater treatment system CAPEX for this duty ranges from $1.8M for a 1 GW non-ZLD plant to $8M for a 5 GW zero liquid discharge facility. OPEX savings of 20–30% are available from zero-fouling membrane designs.
Solar Cell Wastewater Treatment System CAPEX: 2026 Budget Baselines
Solar cell wastewater treatment system CAPEX runs from $1.8M for a 1 GW crystalline silicon plant without zero liquid discharge to $8M for a 5 GW ZLD facility. Hybrid DAF-RO-MBR trains remove more than 99% of fluoride. Dosing accuracy, sludge handling scope, and evaporator sizing drive most of the spread between competing quotes.
Most 1 GW crystalline silicon fabs we size land between the non-ZLD and ZLD rows of the cost table below, because partial water reuse raises RO recovery without paying for a full evaporator train. The line items stay the same at every scale: DAF, RO, MBR, chemical dosing, sludge dewatering, and, only for ZLD, evaporation. Buyers who compare these six items quote-for-quote avoid most budget surprises. At the municipal end of the market, our Tokyo wastewater treatment plant cost breakdown shows how plant-scale budgets are assembled.
Semiconductor neighbors budget the same way. Our gallium nitride capex system breakdown applies the identical line-item method at GaN scale. Solar fabs differ mainly in fluoride load, which shifts money toward precipitation chemistry and additional RO stages.
Why Solar Cell Wastewater Treatment Fails: The $1.2M Penang Lesson
A 500 MW crystalline silicon fab in Penang, Malaysia, was fined $1.2M for exceeding fluoride limits, 15 mg/L against the 10 mg/L standard under Malaysia’s Environmental Quality Act 1974. The root cause was inadequate dissolved air flotation (DAF) pretreatment, which allowed severe fouling of the downstream reverse osmosis (RO) membranes. Uptime fell by 30%, chemical cleaning costs climbed, and the fab absorbed compliance penalties on top of reputational damage. Failures of this kind mirror the weak points documented in semiconductor wastewater treatment design.
High-concentration streams from texturing and etching, often carrying 1,000–3,000 mg/L fluoride, need dedicated texturing wastewater treatment before they mix with general effluent. The Penang plant’s original single-stage RO had no robust DAF ahead of it, so precipitated fluoride species and colloids bypassed filtration and accumulated on membrane surfaces. Segregating concentrated fluoride streams at source costs less than oversizing the central plant to absorb them.
The retrofit installed a hybrid DAF-RO-MBR train with an advanced flotation stage first. A Dissolved Air Flotation (DAF) System now strips suspended solids and colloids ahead of the membranes, extending RO life and restoring uptime. The lesson generalizes: any solar cell wastewater treatment design that treats DAF as optional is accepting membrane replacement as an operating habit.
What Is in Solar Cell Wastewater Streams?
Crystalline silicon fabs discharge effluent high in fluoride (500–1,500 mg/L), chemical oxygen demand (COD, 100–300 mg/L), and total suspended solids (TSS, 50–200 mg/L), mainly from texturing and etching. Those steps consume hydrofluoric acid (HF), nitric acid (HNO₃), and phosphoric acid (H₃PO₄), which is why hydrofluoric acid wastewater treatment dominates the process design. Published ranges bracket this load. Sinharoy et al. (2024) place fluoride in electronics industry wastewater at 300 to 4500 mg/L, and Saltworks Technologies reports industrial streams from 100 mg/L to more than 10,000 mg/L.
Thin-film fabs are a different problem. Cadmium telluride (CdTe) and copper indium gallium selenide (CIGS) lines release cadmium (5–50 ppm), tellurium (2–20 ppm), copper, and indium from deposition and cleaning stages, creating distinct cadmium telluride wastewater chemistry. Both routes also produce dilute rinsing streams carrying isopropanol, acetone, and surfactants, which add COD load. Mapping these streams is the first step of any solar cell manufacturing effluent characterization, because segregated streams cost less to treat than blended ones.
| Contaminant | Crystalline Silicon (Typical Range) | Thin-Film CdTe/CIGS (Typical Range) |
|---|---|---|
| Fluoride | 500–1,500 mg/L | <50 mg/L |
| COD | 100–300 mg/L | 150–400 mg/L |
| TSS | 50–200 mg/L | 20–100 mg/L |
| Cadmium (Cd) | <1 mg/L | 5–50 mg/L |
| Tellurium (Te) | <1 mg/L | 2–20 mg/L |
| Copper (Cu) | <5 mg/L | 1–10 mg/L |
| Indium/Gallium | <1 mg/L | 1–15 mg/L |
Hybrid DAF-RO-MBR System Design: Process Flow and Parameter Specs
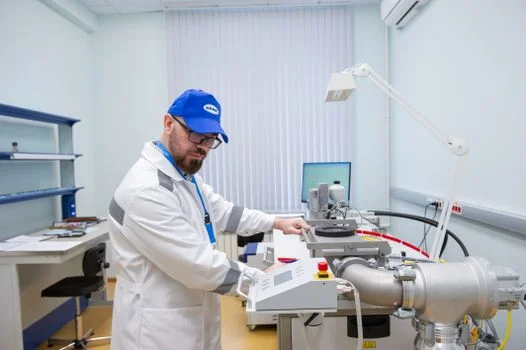
Hybrid DAF-RO-MBR systems chain three stages toward more than 99% contaminant removal: DAF takes suspended solids, RO takes dissolved salts and fluoride, and MBR cuts organic load. The typical solar cell wastewater treatment design sequence is chemical precipitation and coagulation-flocculation, then DAF, then RO, then MBR polishing. Each stage protects the next, which keeps membrane replacement off the monthly agenda.
The DAF stage, built around a DAF system for TSS removal in solar cell wastewater, removes 95–99% of TSS, oil, grease, and colloidal particles at a surface loading rate of 4–8 m³/h/m². This pretreatment is what keeps downstream membranes clean. For fluoride precipitation chemistry, calcium hydroxide (Ca(OH)₂) dosing holds pH at 8–9 and converts soluble fluoride into insoluble calcium fluoride (CaF₂), which flotation captures. The RO stage then finishes the job: high-recovery RO systems for fluoride removal in PV fabs (JY series) push removal past 99%, to below 10 mg/L, at 75–85% recovery and a flux of 15–20 L/m²/h.
The MBR stage handles what precipitation and RO leave behind, biologically. Submerged PVDF MBR systems for COD reduction in solar cell wastewater (DF series) cut COD to ≤50 mg/L at an organic loading rate of 0.1–0.3 kg COD/kg MLSS/day. Dosing of NaOH for pH, PAC for coagulation, and Ca(OH)₂ for fluoride precipitation runs through a PLC-controlled chemical dosing system for fluoride precipitation and pH adjustment. The result is steady reaction conditions and chemical consumption that stays inside the budgeted band.
Fluoride Removal and RO Membrane Cost Drivers
Chemistry sets a floor before membranes set the price. According to Saltworks Technologies, calcium fluoride precipitation can reduce fluoride down to about 8–20 mg/L, and a second aluminum-based coagulation step is required to reach less than 5 mg/L. That is exactly why the design in Table 2 pairs lime precipitation (over 90% reduction) with RO polishing to below 10 mg/L, instead of relying on chemistry alone.
Lime itself has limits worth pricing. Its solubility is only 0.18% by weight, so high-fluoride plants dose calcium chloride alongside it, per Saltworks Technologies. On the capital side, RO membrane cost tracks flux and recovery: pushing flux above the 15–20 L/m²/h band buys smaller vessels but pays back in faster fouling and earlier replacement. Plants that protect flux with good DAF pretreatment typically replace elements on schedule, not on panic.
Crystallization offers a lower-sludge alternative where fluoride loads are extreme. Sinharoy et al. (2024) report that fluidized-bed CaF₂ crystallization, tested at ambient temperature (25 °C) and atmospheric pressure, achieved 82.5% fluoride removal with 95.1% crystallization efficiency. The same study recommends the process for influent at 10,000 mg/L or less, which covers the concentrated texturing and etching streams listed above.
| Treatment Stage | Key Function | Typical Parameter | HydropureWater Spec/Range | Achieved Removal/Reduction |
|---|---|---|---|---|
| DAF | TSS, Oil & Grease, Particulate removal | Surface Loading Rate | 4–8 m³/h/m² | 95–99% TSS removal |
| Fluoride Precipitation | Fluoride conversion to CaF₂ | pH Range | 8–9 (Ca(OH)₂ dosing) | >90% Fluoride reduction (pre-RO) |
| RO (JY Series) | Dissolved solids, Fluoride, Heavy Metal removal | Flux Rate | 15–20 L/m²/h | >99% Fluoride removal (to <10 mg/L) |
| Recovery Rate | 75–85% | 75–85% Water Recovery | ||
| MBR (DF Series) | Biodegradable organics (COD, BOD) | Organic Loading Rate | 0.1–0.3 kg COD/kg MLSS/day | >90% COD reduction (to <50 mg/L) |
| Chemical Dosing (Automatic System) | pH adjustment, Coagulation, Precipitation | Dosing Accuracy | ±2% | Optimized chemical consumption |
Crystalline Silicon vs. Thin-Film: Wastewater Treatment Cost and Design Differences
Crystalline silicon lines fight fluoride; thin-film lines fight metals. For c-Si fabs, the core solar cell wastewater treatment design task is hydrofluoric acid wastewater treatment through DAF and RO, with MBR behind them for organics. A 1 GW c-Si fab should budget CAPEX from $1.8M for a non-Zero Liquid Discharge (ZLD) configuration to $4.5M for a ZLD facility. The design target is discharging fluoride below 10 mg/L.
Thin-film CdTe and CIGS fabs invert the priority to heavy metals. Chemical precipitation with sodium sulfide (Na₂S) drives cadmium and tellurium below 1 ppm, consistent with EPA 40 CFR Part 469 requirements. That step is followed by DAF for particulates, MBR for organics, and RO for salinity and residuals. CAPEX for a 1 GW thin-film fab runs from $2.2M non-ZLD to $5M ZLD, reflecting the extra metal-removal train.
| Feature | Crystalline Silicon (c-Si) Fabs | Thin-Film (CdTe/CIGS) Fabs |
|---|---|---|
| Primary Contaminants | Fluoride, COD, TSS, Nitrates | Cadmium, Tellurium, Copper, Indium, COD, TSS |
| Key Treatment Focus | Fluoride removal, organics reduction | Heavy metal precipitation, organics reduction |
| Core Treatment Stages | DAF, Fluoride Precipitation, RO, MBR | Chemical Precipitation (Heavy Metals), DAF, MBR, RO |
| Specific Removal Chemistry | Ca(OH)₂ for F⁻ precipitation, PAC for coagulation | Na₂S for Cd/Te precipitation, pH adjustment |
| Typical 1 GW CAPEX Range | $1.8M–$4.5M | $2.2M–$5M |
| Key Compliance Standards | China GB 8978-1996 (F, COD, TSS), local limits | EPA 40 CFR Part 469 (Cd, Te, Cu), local limits |
How Much Does Solar Panel Manufacturing Wastewater Treatment Cost?
For a 1 GW crystalline silicon plant, expect $1.8M (non-ZLD) to $4.5M (ZLD); for a 1 GW thin-film plant, $2.2M to $5M. Those budgets buy the integrated DAF-RO-MBR infrastructure plus the fluoride or heavy-metal specific stages. OPEX then becomes the lever: zero-fouling membrane designs cut chemical cleaning costs by 25–30% and downtime by about 20% across the service life. Those percentages are why PV fab wastewater treatment quotations should always show cleaning frequency assumptions, not just equipment prices.
Zero liquid discharge solar cell systems cost more up front and pay back where water is scarce or permits are tight. According to a 2025 circular water model, ZLD cuts fresh water consumption by up to 79% and wastewater discharge by 84% at 5 GW scale. The savings arrive as avoided water acquisition and discharge fees. Sludge from fluoride precipitation or metal removal needs dewatering on a plate and frame filter press for sludge dewatering for solar cell wastewater treatment residuals that keeps disposal volumes and haulage costs down.
| Fab Capacity | System Type | DAF | RO | MBR | Chemical Dosing | Sludge Dewatering | Evaporator/Crystallizer (for ZLD) | Total CAPEX (Est.) |
|---|---|---|---|---|---|---|---|---|
| 1 GW (c-Si) | Non-ZLD | $300K | $600K | $500K | $200K | $200K | — | $1.8M |
| 1 GW (c-Si) | ZLD | $350K | $1.5M | $700K | $350K | $600K | $1.0M | $4.5M |
| 1 GW (Thin-Film) | Non-ZLD | $300K | $700K | $500K | $200K | $200K | — | $2.2M |
| 1 GW (Thin-Film) | ZLD | $300K | $1.5M | $700K | $300K | $600K | $1.6M | $5.0M |
| 5 GW (ZLD) | ZLD | $700K | $2.5M | $1.5M | $600K | $1.0M | $1.7M | $8.0M |
What Discharge Limits Must Your Fab Meet?
China’s GB 8978-1996 sets the reference envelope for most PV supply chains: fluoride below 10 mg/L, COD below 100 mg/L, and TSS at ≤70 mg/L for solar cell manufacturing effluent. The DAF stage handles the TSS limit almost single-handedly. In the United States, 40 CFR Part 469 governs the electrical and electronic components point source category, and its semiconductor subcategory is defined at 40 CFR § 469.12. Under that subpart, the definitions in 40 CFR part 401 and the chemical analysis methods in 40 CFR part 136 apply.
The heavy-metal side is stricter. Under 40 CFR Part 469, discharge limits include cadmium at ≤0.1 mg/L, tellurium at ≤0.1 mg/L, and copper at ≤3.38 mg/L, values that matter to thin-film manufacturers. Per the regulation text mirrored by Cornell LII, BCT limitations under 40 CFR § 469.19 require pH within the range 6.0 to 9.0. Limits are expressed as a maximum for any 1 day and as an average of daily values for 30 consecutive days.
European fabs face a third framework. Directive 91/271/EEC sets benchmarks of COD ≤125 mg/L, BOD₅ ≤25 mg/L, and TSS ≤35 mg/L for discharges to urban systems. Hybrid DAF-RO-MBR trains clear these numbers with margin: RO holds fluoride under 10 mg/L and MBR brings COD under 50 mg/L. Fabs comparing fluoride removal technologies in the EU should check local sewer limits, since Saltworks Technologies notes some jurisdictions cap fluoride below 2 mg/L and public sewer permits commonly sit below 20 mg/L.
| Standard | Parameter | Limit |
|---|---|---|
| China GB 8978-1996 | Fluoride | ≤10 mg/L |
| COD | ≤100 mg/L | |
| TSS | ≤70 mg/L | |
| EPA 40 CFR Part 469 | Cadmium | ≤0.1 mg/L |
| Tellurium | ≤0.1 mg/L | |
| Copper | ≤3.38 mg/L | |
| EU Directive 91/271/EEC | COD | ≤125 mg/L |
| BOD₅ | ≤25 mg/L | |
| TSS | ≤35 mg/L |
Next Steps: Scope Your System Before You Buy
Five scoping decisions move the final quote more than any supplier discount. Fix them before inviting bids:
- Stream segregation: keep texturing and etching fluoride streams (1,000–3,000 mg/L) out of the general effluent blend.
- Discharge route: direct surface water, public sewer, or ZLD, because each sets a different fluoride target.
- Cadmium and tellurium duties: required only for CdTe and CIGS lines, sized to 1 ppm discharge targets.
- Water reuse targets: MBR effluent for utilities first, RO permeate for rinses later.
- Sludge plan: filter press capacity matched to CaF₂ and metal hydroxide volumes.
Then send the stream data, the target limits, and the reuse goal to one engineering partner who sizes all three stages together. Undersized DAF paired with oversized RO is the most expensive combination on the market. Request a quote with your fab capacity and effluent analysis, and we will return a DAF-RO-MBR configuration priced against the line items in Table 4.
Frequently Asked Questions
What Is the Biggest Mistake in Solar Cell Wastewater Treatment Design?
Skipping robust DAF pretreatment is the biggest and most expensive mistake. The Penang case shows how inadequate DAF fouls reverse osmosis membranes, cutting uptime by up to 30% while raising cleaning costs and non-compliance exposure. A properly sized DAF stage removes 95–99% of suspended solids first, protecting RO and MBR membranes and keeping effluent stable.
Can Treated Wastewater Be Reused in a Solar Cell Fab?
Yes, MBR effluent is the easiest stream to reuse. With COD typically below 50 mg/L, it suits rinsing, cooling tower makeup, and utility water. The 2025 circular water model shows reuse plus ZLD cutting fresh water consumption by up to 79% and discharge by 84% at 5 GW scale. RO permeate closes the loop further where ultrapure rinse quality is required.
How Do You Remove Cadmium from Thin-Film Wastewater?
Chemical precipitation with sodium sulfide (Na₂S) removes cadmium effectively. Dosing converts soluble cadmium into insoluble cadmium sulfide, which DAF or clarification then separates. The step routinely achieves discharge concentrations below 1 ppm, satisfying limits such as EPA 40 CFR Part 469 for cadmium and tellurium. Hold pH inside the precipitation band, because sulfide selectivity is narrow.
What Is the CAPEX Difference Between ZLD and Non-ZLD Systems?
ZLD costs roughly 2.5 times more in CAPEX than non-ZLD at the same capacity. A 1 GW crystalline silicon fab pays about $1.8M non-ZLD versus $4.5M with ZLD, mainly for brine concentrators and crystallizers. In return, discharge volumes drop by up to 84% and reuse rises, recovering the premium where water or discharge permits are tight.