PCB electroplating wastewater requires specialized treatment to recover 99.9% of heavy metals (Cu, Ni, Pb) and achieve zero liquid discharge (ZLD). Typical influent contains 50–500 mg/L Cu²⁺, 10–100 mg/L Ni²⁺, and 20–200 mg/L fluoride, with COD levels up to 1,200 mg/L. Effective systems combine micro-electrolysis for COD reduction (90%+ removal), ion exchange for metal recovery (99.9% efficiency), and RO/evaporation for ZLD. Compliance with China’s GB 39731-2020 (Cu <0.5 mg/L, Ni <0.1 mg/L) or EPA limits demands tailored engineering specs—this guide provides 2025 benchmarks for design and procurement.
Why PCB Electroplating Wastewater Treatment Fails: 5 Hidden Engineering Pitfalls
Complexing agents such as EDTA and ammonia (NH₄⁺) are the primary reason conventional precipitation fails in PCB facilities, as they form stable metal-chelate structures that prevent hydroxide formation. In many plants, engineers find that even with heavy dosages of sodium hydroxide, effluent copper levels remain above 2.0 mg/L. Advanced oxidation processes (AOPs), specifically Fenton’s reagent, must be deployed to break the chelate bonds. Engineering data suggests a 95% removal rate of complexed metals when maintaining a pH of 3.0–3.5 and an Fe²⁺:H₂O₂ ratio of 1:3 (Zhongsheng field data, 2025).
Variable flow rates, often fluctuating between 5 and 50 m³/h depending on production cycles, frequently disrupt chemical dosing precision and hydraulic retention times. Case studies from large-scale PCB manufacturers indicate that installing equalization tanks with a minimum 8-hour retention capacity can reduce flow variability by 70%, ensuring the stability of downstream precise pH and chemical dosing systems. Chemical over-dosing leads to excessive sludge, while under-dosing results in compliance failure.
Fluoride management is another frequent point of failure. Concentrations of 20–200 mg/L require a two-stage precipitation approach using calcium chloride (CaCl₂) followed by aluminum sulfate (Al₂(SO₄)₃). A design ratio of 1.5:1 Ca:F is necessary to reach the <10 mg/L threshold. High organic loads (COD 500–1,200 mg/L) from photoresist stripping and inks can foul expensive membranes in weeks. Implementing pre-treatment for PCB wastewater via micro-electrolysis can reduce COD by 90%, protecting the Reverse Osmosis (RO) membranes used in ZLD loops.
PCB Wastewater Streams Decoded: Pollutant Concentrations, Sources & Treatment Priorities
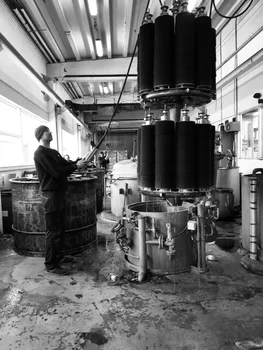
PCB manufacturing generates highly heterogeneous waste streams that must be segregated at the source to prevent the formation of untreatable "mixed" pollutants. Source segregation allows for targeted detailed copper recovery engineering specs and more efficient overall system operation. Acidic etching and alkaline stripping streams, for instance, should never be combined before pre-treatment due to the risk of uncontrolled exothermic reactions and the stabilization of metal complexes.
| Stream Type | Key Pollutants | Concentration Range | pH Range | Treatment Priority |
|---|---|---|---|---|
| Heavy Metal Rinse | Cu²⁺, Ni²⁺, Pb²⁺ | Cu: 50–500 mg/L; Ni: 10–100 mg/L | 2.0–4.0 | Metal Recovery (99.9%) |
| Complexed Waste | Cu-EDTA, Ni-Ammonia | Metals: 20–150 mg/L | 8.0–10.0 | Oxidation / Chelate Breaking |
| Fluoride Stream | F⁻, HF | 20–200 mg/L | 1.0–3.0 | Two-stage Precipitation |
| Organic (Ink) Waste | COD, Surfactants | COD: 500–1,200 mg/L | 11.0–13.0 | Acidification / Micro-electrolysis |
The sources of these pollutants are specific to the PCB fabrication stages: copper primarily stems from acid dips and etching, nickel from electroless plating baths, and fluoride from micro-etching processes. Compliance with China's GB 39731-2020 standards (Cu <0.5 mg/L, Ni <0.1 mg/L) is significantly more stringent than the US EPA’s 40 CFR Part 433 limits, requiring engineers to prioritize nickel removal and compliance strategies during the initial design phase.
Treatment Technology Comparison: Ion Exchange vs. RO vs. Electrocoagulation for PCB Wastewater
Selecting the appropriate treatment technology requires a decision framework based on the specific pollutant load, required effluent quality, and operational budget. Ion exchange remains the gold standard for high-purity metal recovery, capable of achieving 99.9% copper removal. However, it is highly sensitive to resin fouling from organic additives and requires frequent regeneration cycles every 4–8 hours depending on the influent concentration. When designing for ion exchange, pre-filtration to <1 NTU is mandatory to maintain resin longevity.
| Technology | Removal Efficiency | CapEx (Est.) | OpEx ($/m³) | Footprint | Best For |
|---|---|---|---|---|---|
| Ion Exchange | Cu/Ni 99.9% | $500k – $2M | $0.50 – $1.20 | Medium | High-value Metal Recovery |
| Reverse Osmosis | Salts 98%, Metals 99% | $800k – $2.5M | $0.70 – $1.50 | Small | Water Reuse / ZLD |
| Electrocoagulation | F⁻ 95%, COD 60% | $300k – $1M | $0.40 – $0.90 | Small | Fluoride & COD Pre-treatment |
| Micro-Electrolysis | COD 90%, Color 95% | $200k – $800k | $0.20 – $0.50 | Large | Refractory Organic Removal |
Reverse Osmosis (RO) is the central component of water reuse and ZLD systems, typically providing 75–90% water recovery. To prevent membrane scaling, Reverse Osmosis (RO) water purification systems must be preceded by ultrafiltration or microfiltration. For fluoride removal, electrocoagulation offers a compact alternative to chemical precipitation, operating at 5–10 A/dm² current density. While efficient, it produces 0.5–1 kg/m³ of sludge, necessitating a sludge dewatering for ZLD systems to manage disposal costs.
Zero Liquid Discharge (ZLD) for PCB Wastewater: Engineering Specs & Cost Breakdown
Implementing a Zero Liquid Discharge (ZLD) system for PCB manufacturing involves a multi-stage process designed to eliminate liquid waste while recovering valuable resources. A typical process flow starts with equalization, followed by micro-electrolysis for COD reduction, ion exchange for metal recovery, and a multi-stage RO system. The final stage utilizes Mechanical Vapor Recompression (MVR) or multi-effect evaporation to crystallize the remaining salts into a solid form for disposal or industrial reuse.
CapEx for a ZLD system ranges from $1.2M to $3.5M for a facility processing 100–500 m³/day. The primary cost drivers are the evaporation modules and the specialized metallurgy required to resist corrosion from concentrated brines. OpEx typically fluctuates between $0.80 and $2.50/m³, though this is often offset by the recovery of high-purity copper ($5–$15/kg) and the savings from recycled process water ($0.50–$2.00/m³). Real-world data from Aries’ Northeastern PCB facility indicates that a well-optimized ZLD system can achieve a return on investment (ROI) within 2 to 5 years.
Engineering specifications for the ZLD RO stage should include a flux rate of 12–15 GFD (gallons per square foot per day) and the use of high-rejection, fouling-resistant membranes. For the disinfection of recycled water to be used in sensitive rinsing stages, a chlorine dioxide generator is often integrated to maintain bacteria levels below 10 CFU/mL without the corrosive side effects of high chlorine dosages.
Compliance & Risk Mitigation: Meeting GB 39731, EPA, and Local PCB Wastewater Limits
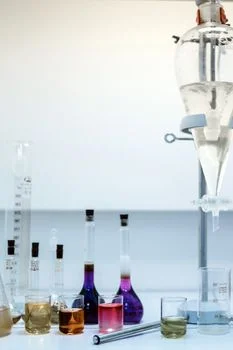
Compliance failure in the PCB industry is often a result of analytical interference rather than system failure. For example, EDTA can mask metal ions during standard colorimetric testing, leading to false negatives. Regulatory compliance with China’s GB 39731-2020 or EU Directive 2010/75/EU requires the use of ICP-MS (Inductively Coupled Plasma Mass Spectrometry) for accurate heavy metal measurement. Designing a system for "Zero Risk Compliance" involves redundant monitoring and automated fail-safes.
| Standard | Cu (mg/L) | Ni (mg/L) | Pb (mg/L) | F⁻ (mg/L) | COD (mg/L) |
|---|---|---|---|---|---|
| China GB 39731-2020 | < 0.5 | < 0.1 | < 0.1 | < 10 | < 50 |
| EPA 40 CFR Part 433 | < 2.7 | < 2.3 | < 0.4 | N/A | N/A |
| EU 2010/75/EU | < 0.5 | < 0.5 | < 0.2 | < 15 | < 100 |
Risk mitigation strategies must address the scaling potential of mixed waste streams. Combining acidic and alkaline streams can cause calcium sulfate or carbonate scaling in RO membranes