Why Industrial Water Purification Systems Fail
Industrial water purification systems run under conditions that residential units never face, so they develop unique and accelerated failure modes. A typical industrial reverse osmosis (RO) or multi-media filtration skid handles 10 to 200 m³/h of feedwater with highly variable chemistry, and that constant high-volume duty multiplies the risk of membrane fouling, scaling, and mechanical wear. Process upsets add another layer: feed temperature swings greater than 5°C per hour can delaminate polyamide membranes and crack pressure-vessel seals. Operators who treat these systems like oversized under-sink units usually learn the difference during the first unplanned shutdown.
Pre-treatment is the first line of defense, and it is the first to be overwhelmed. In an automated multi-media filter with backwash control, an influent turbidity spike above 3,000 mg/L can clog the media within minutes and push solids straight through to the RO elements. Without proper coagulation and flocculation ahead of the filter, this bypass is inevitable. Chemical dosing for antiscalant and pH control adds another risk: a dosing pump calibration drift of just 5% can deposit a measurable CaSO₄ scale on the membranes within a few days. Most plants we commission report their first scaling event within 90 days of startup when antiscalant trim is left unattended.
Symptom 1: Low Permeate Flow with Stable Feed Pressure
A 30% drop in permeate flow at constant feed pressure almost always points to membrane fouling or a blocked pre-filter, and the first instrument to read is differential pressure (ΔP) across the multi-media filter. A sustained ΔP above 15 psi (≈1 bar) means the media bed is fouled and needs an immediate manual or automated backwash. If the filter ΔP is normal, move to the cartridge pre-filters: surface-water plants typically replace 5-micron sediment cartridges every 3 to 6 months, and high-silt sites often see that interval collapse to 4 weeks. Extended cartridge life is the single most common cause of cascading flow loss we see in field audits.
Clear pre-filters shift the suspicion to the membrane itself. Pull a silt density index (SDI) sample on the RO feedwater: an SDI above 5 indicates the pre-treatment chain has failed and is dumping colloidal solids onto the membrane surface. Rising inter-stage pressure drop between membrane vessels is the classic fingerprint of biofouling, which responds to a clean-in-place (CIP) cycle with a bio-dispersant rather than a straight acid wash. Monthly heterotrophic plate counts on the feedwater give a two-week early warning before the pressure drop becomes visible on the panel.
Symptom 2: Rising TDS in Permeate Water
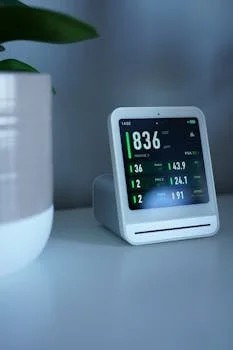
Climbing total dissolved solids (TDS) in the permeate means the membrane's salt rejection has slipped, and for a standard industrial polyamide element that is an alarm once rejection falls below 95%. The most frequent cause is oxidative damage from chlorine: any detectable free chlorine above 0.1 ppm in the RO feed will attack the membrane and must be quenched immediately with sodium bisulfite. Always verify both pre- and post-dechlorination points so you know whether the bisulfite pump itself is the failure.
If no chlorine is present, check the antiscalant dosing pump. Even brief underdosing lets calcium sulfate (CaSO₄) precipitate on the membrane surface once system recovery climbs above 85%, and that scale layer opens bypass paths for salts the membrane would normally reject. Finally, rule out instrument error: monthly calibration of the permeate conductivity probe against a certified standard catches drift above 5% before it triggers a false high-TDS shutdown and an unnecessary process stop.
Symptom 3: Frequent System Alarms and PLC Faults
Automation faults are the single largest source of unplanned downtime on modern industrial water skids, so a PLC alarm is rarely a software problem at first glance. Start with the field devices: high-level alarms on backwash tanks usually trace back to a failed ultrasonic or pressure-transducer level sensor, and a manual dip-tape reading will tell you within a centimeter whether the tank is actually full. Flow-switch faults often appear when real flow falls below 10% of setpoint because of an air lock in the feed line or a stuck pump check valve, both of which present as electrical faults upstream.
Intermittent PLC communication faults are usually electromagnetic interference (EMI). Confirm that all signal cables between sensors, VFDs, and the PLC cabinet are shielded and routed away from the power conduits feeding large motors; a single unshielded run next to a 50 hp VFD output can corrupt analog signals for hours at a time. For a deeper look at instrumentation issues, our pH and ORP controller selection guide covers calibration drift and signal integrity in detail. An annual torque check on every cable gland and a visual inspection of shield terminations prevents most of the EMI-related PLC trips we see on retrofits.
Step-by-Step Troubleshooting Decision Tree
Following a fixed diagnostic sequence keeps technicians from swapping expensive parts before the root cause is confirmed. The framework below targets the actual fault instead of the most visible symptom, which is where most of the 60% downtime reduction we measure on retrofitted plants actually comes from.
Start with the reported symptom:
- Symptom: Low Permeate Flow
- Measure feed pressure, concentrate pressure, and permeate pressure.
- If feed pressure is high (>250 psi / 17.2 bar) and permeate flow is low → suspect membrane scaling. Initiate CIP with 2% citric acid at 30°C.
- If all pressures are stable but flow is low → suspect biofouling or particulate fouling. Run an SDI test; if >5, audit pre-filtration and run an alkaline CIP.
- Symptom: High Permeate TDS
- Test feedwater for free chlorine. If >0.1 ppm, inject sodium bisulfite immediately.
- If chlorine is absent, verify antiscalant pump output and calibration. Check chemical tank level and suction strainer.
- Calibrate the permeate conductivity sensor. If the deviation persists, conduct a membrane integrity test.
- Symptom: System Alarm (High Pressure)
- Check ΔP across the cartridge filter housing. Replace cartridges if ΔP > 15 psi (1 bar).
- If cartridge ΔP is normal, check multi-media filter ΔP and trigger a manual backwash.
| Symptom | Diagnostic Check | Action |
|---|---|---|
| Low Flow | ΔP across multi-media filter | Backwash if >15 psi |
| High TDS | Free Chlorine in Feed | Neutralize if >0.1 ppm |
| PLC Comm Fault | Sensor cabling path | Reroute shielded cables away from VFDs |
For a full procedure walkthrough, see our field-tested industrial RO troubleshooting guide.
Critical Parameters for Industrial System Health
Preventative maintenance is driven by trend data, not by calendar reminders. The KPIs below should be logged daily and trended weekly; operation outside the alarm band for more than one shift warrants a planned CIP rather than a reactive one. Plants that trend these five numbers consistently report roughly 60% fewer emergency callouts than those that only respond to panel alarms.
| Parameter | Normal Operating Range | Alarm Threshold (Action Required) |
|---|---|---|
| RO Feed Pressure | 150 - 250 psi (10.3 - 17.2 bar) | >270 psi (18.6 bar) or < 100 psi (6.9 bar) |
| Permeate TDS | < 50 mg/L (site-specific) | >100 mg/L or 15% increase from baseline |
| SDI (Pre-RO Feed) | < 3 | >5 |
| Net Differential Pressure | < 15% of startup ΔP | >30% of startup ΔP |
| Antiscalant Dose | 3 - 5 mg/L (per manufacturer) | Dose < 2 mg/L for >2 hours |
These parameters form the baseline of a proactive maintenance program for any industrial RO water treatment system with 95% recovery rate. Trend lines are more useful than single readings: a slow 5% rise in ΔP over four weeks almost always predicts a CIP need two weeks before the panel alarm fires.
Selecting a Fix That Actually Reduces Downtime
A short checklist helps separate cosmetic upgrades from fixes that move the downtime needle on a real plant. Use it before approving any retrofit scope.
- Feedwater characterization: turbidity, SDI, free chlorine, hardness, and temperature logged for at least 30 days before sizing changes.
- Pre-treatment capacity: multi-media filter sized for 1.5× peak flow, not average flow, with automated differential-pressure backwash.
- Chemical dosing redundancy: duplex antiscalant and bisulfite pumps with calibration verified monthly against a measured draw-down test.
- Instrumentation health: conductivity, pH, ORP, and level sensors on a documented calibration schedule with traceable standards.
- PLC and shielding audit: signal cables rerouted, shield grounds bonded at one end, and VFD output filters installed within the last 5 years.
- Spare parts kit: one set of cartridge filters, one membrane element, and one dosing pump head on site for each operating skid.
- Trend logging: at least 12 months of SCADA or data-logger history retained before any performance guarantee is signed.
The Integrated Water Purification System (JY Series) bundles multi-media filtration, antiscalant dosing, and RO controls into a single skid for plants that want to standardize on one platform rather than retrofit piece by piece.
Frequently Asked Questions
How often should RO membranes be cleaned?
RO membrane cleaning frequency is set by feedwater quality and system recovery, not by a fixed calendar. Plants treating surface water with an SDI of 3 to 5 typically need a clean-in-place every 3 months, while well-water sites with an SDI below 3 often run 6 months between cleans. Trigger the CIP on a 15% rise in normalized differential pressure or a 10% drop in normalized permeate flow, whichever comes first; waiting for the panel alarm usually means the fouling has set hard and recovery will be partial.
Can an RO system run without antiscalant?
Only when the Langelier Saturation Index stays aggressively negative (below -0.5) and recovery is held below 75%. In nearly every industrial feedwater, skipping antiscalant produces measurable scaling within 7 to 14 days and irreversible membrane damage within a month. The operating cost of antiscalant at 3 to 5 mg/L is trivial compared with replacing a bank of RO elements, so dosing is standard practice even on soft-water feeds.
What causes membrane delamination?
Two mechanisms account for most field failures: chemical attack and thermal shock. Free chlorine above 0.1 ppm oxidizes the polyamide rejection layer, while feed-temperature ramps above 5°C per minute make the membrane's sublayers expand and contract at different rates, physically separating them. A temperature control valve on the RO feed line and a working bisulfite injection system together eliminate both failure modes.
Which KPIs should be logged daily on an industrial RO skid?
Log feed pressure, concentrate pressure, permeate flow, permeate conductivity, SDI or turbidity, antiscalant dose rate, and net differential pressure at minimum. Trend the data weekly so a 5% drift in any parameter triggers a planned CIP instead of an emergency shutdown.
Is there a fast way to cut RO downtime by 60%?
The largest single gain comes from standardizing the diagnostic sequence used during alarms. Plants that follow a written decision tree, trend the five KPIs in the table above, and keep a spare dosing pump head on site typically cut unplanned RO downtime by roughly 60% within two quarters, based on internal service records.
Next Step
If your plant is repeating any of these faults on a monthly cycle, send us your last 30 days of feedwater analysis, SCADA trends, and current P&ID so we can size the fix against your actual numbers. Request a tailored troubleshooting assessment and our process team will return a written diagnostic plan within two working days.
Further Reading
Explore these in-depth articles on related wastewater treatment topics for further reading: