Quick-Check Pressure Profile: Find the Failing Stage in 5 Minutes
A 5-point pressure profile offers the fastest, most accurate method to diagnose industrial RO system performance issues, often pinpointing the failing stage in under five minutes. By logging pressures at key points—feed, inter-stage 1–2, inter-stage 2–3, concentrate, and permeate—under steady-state operating conditions, you can quickly identify deviations from OEM specifications. A differential pressure (ΔP) across an individual pressure vessel exceeding 2.1 bar typically indicates membrane fouling, while a ΔP below 0.5 bar might suggest scaling or bypass. Comparing these live readings against your system’s baseline and OEM specification sheet allows for immediate identification of problem areas. For example, if permeate TDS rises by more than 50 mg/L within 30 minutes following a Clean-In-Place (CIP) cycle, it strongly suggests an O-ring bypass rather than membrane failure, guiding you to a less invasive and faster repair.Table 1: RO System Pressure Profile Diagnostic Parameters
| Parameter | Normal Operating Range | Alert Threshold | Action Limit | Indication |
|---|---|---|---|---|
| Feed Pressure | ±5% of OEM spec | >10% drop from baseline | >15% drop from baseline | Pre-filtration issue or pump loss |
| Inter-stage 1-2 ΔP | <1.0 bar | >1.5 bar | >2.1 bar (Zhongsheng field data, 2025) | Front-end membrane fouling |
| Inter-stage 2-3 ΔP | <1.0 bar | >1.5 bar | >2.1 bar (Zhongsheng field data, 2025) | Mid-to-back-end membrane fouling |
| Concentrate Pressure | ±5% of OEM spec | >10% drop from baseline | >15% drop from baseline | Post-filtration or flow restriction |
| Permeate Pressure | >0.5 bar | <0.5 bar | <0.2 bar | Permeate line blockage |
| Permeate TDS Increase | <10 mg/L | >20 mg/L (over 1 hour) | >50 mg/L (within 30 min) | Membrane damage or O-ring bypass |
| Normalized Permeate Flow | ±5% of design | >10% drop from baseline | >15% drop from baseline | System-wide performance loss |
Pump Cavitation: Kill It Before It Cracks the Impeller
To resolve minor cavitation issues and restore flow:
- Verify Pre-filter Condition: Check the pressure differential across your pre-filters. If it exceeds 1 bar, replace the cartridge filters immediately.
- Inspect Suction Line: Look for any visible leaks, kinks, or obstructions in the suction piping. Ensure all valves are fully open.
- Vent the Pump: Slowly open the pump's vent valve (if equipped) to release trapped air while the pump is running at low speed. Continue until a steady stream of water, free of bubbles, emerges.
- Drain Low Points: For systems that have been shut down or drained, open low-point drains on the suction side for 30 minutes to ensure complete air removal before restarting the pump.
- Monitor NPSH: After remediation, re-measure suction pressure and calculate NPSH margin to confirm it meets the minimum 0.5 bar requirement.
Membrane Fouling vs Scaling: Which Cleaning Recipe to Use
Accurately distinguishing between membrane fouling and scaling is critical, as using the wrong cleaning chemistry can exacerbate performance issues and damage membranes. Fouling is characterized by a high differential pressure (ΔP >2.1 bar) across the membrane elements, often with little to no increase in permeate TDS. This indicates organic matter, colloids, or biological films obstructing the membrane surface. Scaling, conversely, typically presents with a normal or low ΔP across the membranes but a significant and often sudden increase in permeate TDS, caused by mineral precipitation like calcium carbonate or sulfate. For fouling, an alkaline cleaning solution is most effective. Use a pH of 11.5 at 35 °C with a 30-minute recirculation period (Zhongsheng field data, 2025). This dissolves organic matter and disperses colloids. For scaling, an acidic cleaning solution is required. Citric acid at pH 2.5 and 30 °C for 45 minutes of recirculation is a standard approach to dissolve mineral deposits. Aim for a flux recovery target of at least 95% of the design flow after any CIP procedure. A cleaning interval of approximately 90 days is recommended when the ΔP across the lead elements consistently exceeds 2.1 bar, provided this maintains flux within 5% of the design value (Zhongsheng field data, 2025).Table 2: RO Membrane Cleaning Parameters
| Issue | Characteristic Symptoms | Recommended Cleaning Agent | pH Range | Temperature Limit | Contact Time | Target Flux Recovery |
|---|---|---|---|---|---|---|
| Fouling (Organic/Bio) | High ΔP (>2.1 bar), low or no TDS increase, reduced flow | Alkaline cleaner (e.g., NaOH with surfactant) | 10.5 – 11.5 (Zhongsheng spec) | 35 °C (max 40 °C) | 30-60 minutes recirculate | ≥95% of design flow |
| Scaling (Mineral) | Normal ΔP (<0.5 bar), sudden high TDS, reduced flow | Acid cleaner (e.g., Citric acid, HCl) | 2.0 – 3.0 (Zhongsheng spec) | 30 °C (max 35 °C) | 45-90 minutes recirculate | ≥95% of design flow |
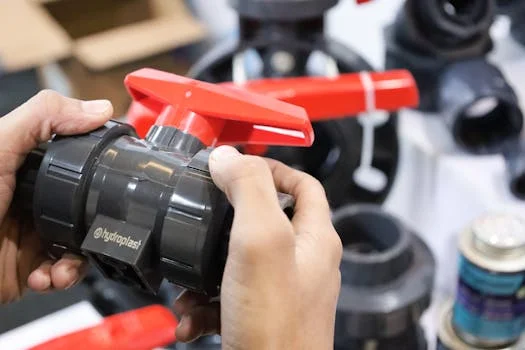
High TDS Spikes: O-Ring or Membrane?
Antiscalant Dosage Matrix: Match Chemical to Your LSI/SDI
Precise antiscalant dosage, tailored to your feed water's Langelier Saturation Index (LSI) and Silt Density Index (SDI), is essential to prevent scaling and optimize chemical spend, saving up to USD 0.08 per 100 m³ of water treated for every 1 ppm reduction in overfeed (Zhongsheng field data, 2025). Overdosing antiscalant is a common and costly mistake. The following matrix provides a guideline for phosphonate-based antiscalant dosages based on typical LSI and SDI values, removing guesswork from chemical spend.Table 3: Antiscalant Dosage (ppm) by LSI and SDI Range
| LSI Range \ SDI Range | <3 (Low Scaling/Fouling Risk) | 3-5 (Moderate Risk) | >5 (High Risk) |
|---|---|---|---|
| 0-1 (Undersaturated) | 2.0 ppm (minimum) | 2.5 ppm | 3.0 ppm |
| 1-2 (Slightly Saturated) | 3.0 ppm | 3.5 ppm | 4.0 ppm |
| >2 (Highly Saturated) | 4.0 ppm | 4.5 ppm | 5.0 ppm |
Note: Dosage rates are for typical phosphonate-based antiscalants. Adjust based on specific product concentration and manufacturer recommendations. Increase dosage by 20% if feed water temperature exceeds 40 °C.
Maintaining feed water temperature below 40 °C is crucial; exceeding this limit requires a 20% increase in antiscalant dosage to maintain effectiveness. Implementing a PLC antiscalant dosing package with flow-proportional control can ensure precise chemical delivery, preventing both under- and over-dosing, and significantly contributing to the longevity of your membranes and overall system efficiency.
Cost of Downtime Calculator: Justify Spare Parts Budget Today
Table 4: Estimated Cost of RO System Downtime
| Downtime Hours | Lost Permeate (m³) | Lost Revenue (USD) | Estimated Spare Part Kit Cost (USD) |
|---|---|---|---|
| 1 | 10 | 45 | 500 (O-rings/Seals) |
| 6 | 60 | 270 | 1,500 (Pump Seal Kit) |
| 24 | 240 | 1,080 | 3,000 (Single Membrane Element) |
| 72 | 720 | 3,240 | 5,000 (Multiple Membrane Elements) |
Note: Lost permeate assumes a typical 10 m³/h RO system. Spare part costs are illustrative and vary by OEM and specific components.
The cost of waiting for parts can quickly eclipse the initial investment in spares. For high-purity water applications in food and beverage, ensuring immediate access to critical components minimizes production disruption and safeguards product quality, providing clear justification for an overnight courier for membranes or a comprehensive spare parts budget.
Frequently Asked Questions
Understanding common RO system queries can significantly reduce troubleshooting time and improve operational efficiency.- What is a major problem with reverse osmosis?
- A major problem in industrial reverse osmosis systems is membrane fouling, which accounts for up to 70% of performance declines. This leads to increased operating pressure and reduced permeate flow, requiring frequent cleaning or membrane replacement if not managed effectively.
- How do I troubleshoot my reverse osmosis system?
- Begin by performing a 5-point pressure profile to identify pressure drops across stages. Then, check for pump cavitation, verify antiscalant dosage against LSI/SDI values, and test for O-ring bypass if TDS spikes. This systematic approach can resolve over 60% of common issues rapidly.
- What is the lifespan of the industrial RO membrane?
- The typical lifespan of an industrial RO membrane is 3 to 5 years, though this can be extended to 7 years with optimal pretreatment, consistent antiscalant dosing, and timely chemical cleaning when differential pressure exceeds 2.1 bar. Neglecting these factors can reduce lifespan by 50%.
- How often should RO membranes be cleaned?
- RO membranes typically require cleaning every 3 to 12 months, or when the normalized permeate flow drops by 10-15% or the differential pressure across a stage increases by 15-20% from the baseline. This proactive cleaning schedule, often every 90 days, helps maintain flux recovery above 95%.