Why Brackish Water RO Systems Are Critical for Industrial Water Supply
Groundwater Total Dissolved Solids (TDS) levels in heavy industrial zones, such as the semiconductor hubs in Shandong or the manufacturing districts of Hangzhou, often range from 2,500 to 5,000 mg/L, significantly exceeding the 500 mg/L threshold required for most process water applications. For a semiconductor plant, even minor fluctuations in feedwater salinity can lead to catastrophic equipment failure. High TDS levels introduce aggressive ions like chlorides and sulfates that accelerate pitting corrosion in stainless steel piping and cause rapid mineral scaling in high-precision heat exchangers. When TDS levels exceed 1,000 mg/L, conventional ion exchange resins become economically unviable due to the frequency of regeneration cycles and the massive chemical volumes required.
A brackish water reverse osmosis (RO) system removes 98%+ of dissolved salts from feedwater with 1,000–10,000 mg/L TDS using semi-permeable membranes and 15–25 bar pressure—far lower than seawater RO (55–80 bar). According to 2024 Water Environment Federation (WEF) data, RO systems are 30% to 50% more cost-effective than thermal distillation or ion exchange for treating water within the 1,000–10,000 mg/L range. This efficiency is driven by the development of low-energy polyamide membranes that provide high flux at reduced net driving pressures. For example, a 500 m³/day RO system recently implemented for a chip fab in Hangzhou reduced groundwater TDS from 4,200 mg/L to less than 100 mg/L, ensuring the stability of the ultrapure water (UPW) polishing loop while maintaining a system footprint 40% smaller than an equivalent chemical treatment train (HydropureWater field data, 2025).
Industrial facility managers prioritize BWRO because it offers a modular, automated solution to water scarcity. By utilizing customizable industrial RO systems for brackish water treatment, plants can tap into "marginal" water sources—such as deep well water or reclaimed process water—that were previously considered too saline for use. This not only secures the water supply against municipal shortages but also significantly reduces the cost per cubic meter of treated water compared to purchasing municipal water or hauling in fresh supply.
Step-by-Step Process: How Brackish Water RO Systems Remove Salts and Contaminants
Industrial brackish water RO systems operate through a multi-stage process where pretreatment turbidity must be maintained below 1.0 NTU to protect downstream membranes from irreversible fouling. The process is a balance of hydraulic pressure and chemical equilibrium, designed to overcome the natural osmotic pressure of the saline feedwater. Unlike simple filtration, RO is a cross-flow process where the feedwater is separated into two streams: permeate (purified water) and concentrate (rejected salts).
1. Pretreatment Stage: The goal of pretreatment is to reach a Silt Density Index (SDI15) of less than 3.0. This typically involves sand filtration as a cost-effective RO pretreatment method to remove suspended solids, followed by activated carbon to remove chlorine, which would otherwise oxidize polyamide membranes. To prevent mineral scaling—specifically from calcium carbonate and silica—the system utilizes precise antiscalant and pH adjustment dosing for RO pretreatment. Silica levels must be monitored closely; if feedwater silica exceeds 100 mg/L, specialized antiscalants or pH elevation are required to prevent glass-like scaling on the membrane surface.
2. High-Pressure Pump Stage: The high-pressure pump provides the energy necessary to overcome osmotic pressure and push water molecules through the membrane. For brackish water between 1,000 and 5,000 mg/L TDS, stainless steel centrifugal pumps typically operate in the 15–25 bar range. For higher salinity brackish water (5,000–10,000 mg/L), pressures increase to 25–40 bar. Variable Frequency Drives (VFDs) are essential here to maintain constant permeate flow regardless of temperature-induced flux changes.
3. Membrane Stage: The core of the system utilizes spiral-wound semi-permeable membranes with a pore size of approximately 0.0001 µm. These membranes reject 98% to 99.8% of monovalent and divalent ions (Na⁺, Cl⁻, Ca²⁺, Mg²⁺). In brackish applications, systems are often configured in two or three stages to achieve recovery rates of 75% to 95%. In a two-stage system, the concentrate from the first stage becomes the feedwater for the second stage, maximizing water recovery.
4. Post-Treatment and Discharge: The permeate is often aggressive (low pH and low mineral content), requiring stabilization via full water purification process flow including RO and post-treatment. This may include degasification to remove CO2 and remineralization for corrosion control. The concentrate stream is then managed through sewer discharge or, in high-recovery scenarios, sent to a Zero Liquid Discharge (ZLD) system.
| Process Stage | Critical Parameter | Target Range (Industrial) | Primary Goal |
|---|---|---|---|
| Pretreatment | SDI15 / Turbidity | < 3.0 / < 1.0 NTU | Prevent membrane fouling |
| Chemical Dosing | Antiscalant / pH | 2.0–5.0 mg/L / pH 6.5–7.5 | Prevent CaSO4/Silica scaling |
| RO Stage 1 | Operating Pressure | 15–25 bar | 50–60% individual recovery |
| RO Stage 2 | Flux Rate | 12–18 GFD (20–30 LMH) | Achieve 75–90% total recovery |
| Post-Treatment | LSI (Langelier Index) | -0.5 to +0.5 | Corrosion prevention |
Pressure vs. TDS: How Feedwater Salinity Affects RO System Performance
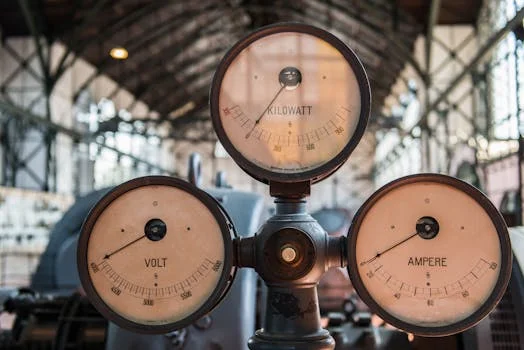
Osmotic pressure in brackish water increases by approximately 0.07 bar for every 100 mg/L of dissolved salts, directly dictating the minimum energy requirements for the high-pressure pump. This relationship is linear but is complicated by the concentration polarization effect at the membrane surface, where the local TDS concentration is higher than the bulk feedwater. For an engineer, calculating the Net Driving Pressure (NDP) is critical: NDP = (Feed Pressure - Osmotic Pressure) - Permeate Pressure - Pressure Drop. If the NDP is too low, permeate flux drops; if it is too high, the membrane may undergo mechanical compaction or rapid fouling.
Temperature plays a secondary but vital role in system pressure requirements. Water viscosity decreases as temperature rises, which increases membrane permeability. According to Dow Filmtec guidelines, RO systems experience a roughly 3% change in permeate flow for every 1°C change in feedwater temperature. In colder climates, systems must be designed with higher pressure pumps to maintain design flow during winter months. Conversely, in summer, the VFD must scale back pump speed to prevent exceeding the maximum flux limits of the membrane elements.
| Feedwater TDS (mg/L) | Osmotic Pressure (approx. bar) | Operating Pressure (bar) | Typical Recovery Rate (%) | Energy Consumption (kWh/m³) |
|---|---|---|---|---|
| 1,000 – 2,000 | 0.7 – 1.4 | 10 – 15 | 85 – 95% | 0.5 – 0.8 |
| 2,000 – 5,000 | 1.4 – 3.5 | 15 – 25 | 75 – 85% | 0.8 – 1.2 |
| 5,000 – 10,000 | 3.5 – 7.0 | 25 – 40 | 70 – 75% | 1.2 – 1.8 |
To optimize energy consumption, many modern industrial plants specify low-energy membranes (e.g., BW30-400 or ESPA2). These membranes feature a more "open" polymer matrix that allows water to pass at lower pressures while maintaining high salt rejection. Implementing these can lead to a 15–20% reduction in kWh/m³ compared to standard brackish water membranes. For large-scale operations, even a 0.2 kWh/m³ savings translates into tens of thousands of dollars in annual OPEX reductions.
Membrane Selection Guide: Choosing the Right RO Membrane for Brackish Water
Polyamide thin-film composite (TFC) membranes are the primary choice for industrial brackish water applications, offering salt rejection rates up to 99.8% at operating pressures between 10 and 25 bar. TFC membranes consist of three layers: a polyester support web, a microporous polysulfone interlayer, and an ultra-thin polyamide barrier layer. While TFC membranes offer superior rejection and flux, they are highly sensitive to oxidizing agents like chlorine. If the pretreatment system fails to neutralize residual chlorine, the polyamide layer will depolymerize, leading to an immediate and irreversible loss of salt rejection.
When selecting a membrane, engineers must consider the "zeta potential" or surface charge. Most standard membranes are negatively charged, which helps repel negatively charged organic matter but can attract certain cationic polymers used in flocculant dosing for RO pretreatment and fouling prevention. For feedwater high in organics or biological activity, "fouling-resistant" membranes with a neutral surface charge or a specialized hydrophilic coating are preferred to extend the interval between Clean-In-Place (CIP) cycles.
| Membrane Type | Rejection Rate (%) | Operating Pressure (bar) | pH Range (Cleaning) | Key Advantage |
|---|---|---|---|---|
| Standard Brackish (BW30) | 99.5 – 99.8% | 15 – 25 | 1 – 13 | High durability, stable rejection |
| Low Energy (ESPA/LE) | 99.0 – 99.4% | 10 – 15 | 2 – 11 | Lowest OPEX for low-salinity water |
| Fouling Resistant (FR) | 99.2 – 99.6% | 15 – 25 | 1 – 13 | Best for high-COD/organic feedwater |
| Cellulose Acetate (CA) | 95.0 – 98.0% | 25 – 40 | 4 – 6 | Chlorine tolerant (rarely used now) |
The configuration of the membrane element also impacts performance. Spiral-wound elements are the industrial standard because they provide a high surface-area-to-volume ratio. For high-purity applications, 8-inch diameter elements are standard, typically 40 inches in length. A standard 8040 brackish water element provides roughly 37–41 m² of active membrane area. Choosing an "Extra Area" element (e.g., 440 sq. ft.) can allow for a lower flux rate per square meter, which reduces the rate of fouling and extends membrane life.
Energy Consumption and Operating Costs: What to Expect for Industrial Brackish Water RO
Energy typically accounts for 30% to 50% of the total operating expense (OPEX) for brackish water RO systems, with consumption rates varying based on feedwater salinity and membrane age. In a well-designed industrial system treating 3,000 mg/L TDS groundwater, the energy consumption usually sits between 0.8 and 1.1 kWh per cubic meter of permeate produced. As membranes age and foul, the required feed pressure increases to maintain the same flow, which can raise energy costs by 10–15% over the three-to-five-year lifespan of the membrane.
Beyond energy, chemical costs for antiscalants and CIP procedures represent a significant portion of the budget. Antiscalant dosing is typically required at a rate of 2 to 5 mg/L of feedwater. While this seems minor, for a system running 24/7 at 500 m³/day, the annual chemical spend can reach several thousand dollars. Maintenance, including cartridge filter replacements every 2–3 months and membrane replacements every 3–5 years, must be factored into the lifecycle cost analysis. According to 2024 Water Environment Federation benchmarks, the total OPEX for industrial BWRO systems ranges from $0.20 to $0.50 per m³ of water produced.
| Cost Component | Estimated Cost ($/m³) | Assumptions / Frequency |
|---|---|---|
| Electrical Energy | $0.06 – $0.15 | Based on $0.10/kWh and 0.6-1.5 kWh/m³ |
| Antiscalant & pH Chem | $0.02 – $0.05 | Continuous dosing at 3 mg/L |
| CIP Chemicals | $0.01 – $0.03 | Quarterly cleaning (Acid/Alkaline) |
| Membrane Replacement | $0.04 – $0.08 | Replacement every 3–5 years |
| Cartridge Filters/Parts | $0.01 – $0.02 | Replacement every 2–4 months |
| Total OPEX | $0.14 – $0.33 | Excludes labor and concentrate disposal |
For industries with high-purity requirements, such as monocrystalline silicon production, the RO stage is just one part of the cost equation. Integrating RO with efficient pretreatment and polishing can lower the overall cost of ownership. For a detailed breakdown of these specific costs, refer to the monocrystalline silicon wastewater treatment cost 2025 engineering breakdown.
Common Operational Problems and How to Troubleshoot Them
A 10-15% increase in normalized pressure drop across an RO stage is the primary diagnostic indicator of membrane fouling or mineral scaling. Monitoring "normalized" data is critical because raw pressure and flow data change with temperature and salinity; normalization mathematically removes these variables to reveal the actual health of the membrane. If the pressure drop increases in the first stage, the issue is likely biological or particulate fouling. If the pressure drop increases in the final stage, it is almost certainly mineral scaling (calcium, barium, or silica) because the salt concentration is highest at the end of the system.
Another common symptom is a "salt passage" increase, where the permeate TDS begins to rise. This can be caused by membrane oxidation (chlorine damage), O-ring leaks in the pressure vessel, or simply natural membrane aging. Mechanical issues, such as a failing high-pressure pump seal or a malfunctioning check valve, can also manifest as erratic flow rates. Operators should utilize precise antiscalant and pH adjustment dosing for RO pretreatment to proactively mitigate the most common cause of downtime: calcium carbonate scaling.
| Symptom | Probable Cause | Recommended Solution |
|---|---|---|
| High 1st Stage Delta-P | Biofouling or silt accumulation | Alkaline CIP (pH 11-12); check pretreatment |
| High Last Stage Delta-P | Mineral scaling (CaCO3, CaSO4) | Acid CIP (pH 2-3); increase antiscalant dose |
| Sudden Salt Passage Increase | Leaking O-ring or membrane damage | Conduct "probing" test; replace seals/elements |
| Gradual Permeate Flow Loss | Membrane compaction or fouling | Normalize data; perform CIP; check temp |
| Low Pump Discharge Pressure | Pump wear or VFD failure | Inspect pump impellers; check VFD settings |
How to Select the Right Brackish Water RO System for Your Application
Specifying a brackish water RO system requires a complete ion balance analysis of the feedwater to ensure the Langelier Saturation Index (LSI) remains within manageable limits for the selected recovery rate. Engineers must not only look at the TDS but also the specific concentrations of silica, iron, manganese, and strontium. For instance, if iron levels exceed 0.05 mg/L, they must be removed during pretreatment to prevent irreversible "iron fouling" on the membrane surface. A robust feedwater analysis is the only way to determine if the system requires a high-efficiency pretreatment for high-FOG or colloidal feedwater or if a simpler integrated water purification unit will suffice.
The decision framework for system selection should follow these technical priorities:
- Capacity and Flux: Design for the peak daily demand, but ensure the "flux rate" (gallons per square foot per day) stays within conservative limits (12–16 GFD for well water) to prevent rapid fouling.
- Recovery Rate Goals: While 90% recovery saves water, it increases the risk of scaling and requires higher pressures. Most industrial systems find a "sweet spot" at 75–80% recovery.
- Redundancy: For 24/7 operations, a 2x50% or 3x50% system configuration is superior to a single 100% train, allowing for maintenance without total plant shutdown.
- Automation Level: Modern systems should include PLC-based controls with remote monitoring, automatic flush cycles upon shutdown, and real-time normalization software.
By matching the pretreatment technology—such as using a DAF system for high-FOG feedwater—to the specific contaminants in the brackish source, facility managers can ensure a 15–20 year service life for the RO equipment with minimal unplanned downtime.
Frequently Asked Questions
What is the difference between brackish water RO and seawater RO?
Brackish water RO (BWRO) treats water with 1,000–10,000 mg/L TDS using 15–25 bar pressure and achieves 75–95% recovery. Seawater RO (SWRO) treats 35,000+ mg/L TDS, requiring 55–80 bar pressure, and typically only achieves 35–50% recovery due to the much higher osmotic pressure.
Can brackish water RO systems handle high silica feedwater?
Yes, but silica is a "limiting foulant." Standard membranes can handle up to 100 mg/L of silica in the concentrate. If levels are higher, you must use specialized antiscalants, reduce the recovery rate, or operate at a higher pH to increase silica solubility.
How often should RO membranes be cleaned?
In most industrial brackish applications, membranes should be cleaned (CIP) every 3 to 6 months. If you find yourself cleaning every month, your pretreatment is inadequate or your flux rate is too high.
What is the typical lifespan of a brackish water RO membrane?
With proper pretreatment and regular CIP, industrial membranes last 3 to 5 years. Factors that shorten this lifespan include frequent chlorine exposure, high-pressure spikes, and improper pH during cleaning.
How do I calculate the recovery rate for my RO system?
The recovery rate is calculated as: (Permeate Flow Rate / Feedwater Flow Rate) × 100. For example, if you feed 100 m³/hr and produce 75 m³/hr of permeate, your recovery rate is 75%.