What can—and cannot—be concluded about Ford’s MBR capacity
No defensible MBR capacity for Ford’s Arizona EV plant can be calculated from the supplied evidence because no verified plant wastewater flow, influent characteristics, effluent limits or Ford design basis is provided. EPA says MBR design should begin with influent characteristics, effluent requirements and flow data. The preliminary capacity must address average flow, peak flow, pretreatment and operational redundancy. EPA recommends an N+1 membrane-unit arrangement for full-treatment installations and says peak design flow should not exceed 1.5–2 times average design flow; otherwise, more membranes or equalization are needed. The usable next step is to obtain those plant inputs and complete a sizing worksheet.
The missing information is decisive. The Arizona industrial wastewater compliance guide does not establish Ford’s wastewater flow, discharge requirements or approved treatment train, and the supplied evidence does not identify an MBR capacity approved for the plant. Any numerical answer based only on the facility’s manufacturing status would be an assumption disguised as an engineering result.
EPA’s Wastewater Management Fact Sheet, published by the U.S. Environmental Protection Agency in 2021, states that designers need basic wastewater information—influent characteristics, effluent requirements and flow data—to design an MBR system. A defensible output at this stage is a treatment-stage sizing concept, not a vendor-proven equipment capacity. The latter requires confirmed design inputs, selected membrane fluxes and equipment-specific guarantees.
Build the Ford wastewater sizing basis
Ford or its wastewater contractor must issue a controlled design-basis package covering segregated streams, flow data, wastewater characterization and the receiving or reuse destination. Request daily average flow, peak-hour and peak-day flow, projected wastewater temperature, pH, COD, BOD, nitrogen, phosphorus, suspended solids and toxicity. Include oil, grease and solvent characteristics where relevant, along with sampling methods, units, averaging periods and data dates.
The discharge or reuse destination must be identified before treatment objectives can be fixed. The applicable permit limits or reuse criteria become the effluent requirements EPA identifies as a core MBR design input; an assumed reuse target is not equivalent to an approved limit. Separate sanitary, process, cooling, storm-water and contaminated stormwater streams before calculating duty, because combining them can inflate the biological load or introduce intermittent loads that should not reach the membranes.
EPA’s Calls Creek installation is useful only as an equipment example. The Wastewater Management Fact Sheet, published by the U.S. Environmental Protection Agency in 2021, reports an average flow of 0.35 million gallons per day, a design flow of 0.67 million gallons per day, and two modules with 400 units each. These figures are not Ford project data and must not be transferred to the Arizona facility.
| Worksheet input | Ford value to confirm | Basis or document required |
|---|---|---|
| Daily average flow | Enter confirmed value and units | Approved water balance or metered record |
| Peak-hour and peak-day flow | Enter each value and averaging basis | Design case with production assumptions |
| Stream segregation | Sanitary, process, cooling and stormwater allocations | Approved drainage and sampling plan |
| Influent characterization | Temperature, pH, COD, BOD, nitrogen, phosphorus, TSS and toxicity | Representative analytical report |
| Contaminants | Oil, grease, solvents and other process-specific constituents | Source inventory and analytical data |
| Effluent requirements | Enter permit limits or approved reuse criteria | Permit, reuse agreement or regulator approval |
| Reference equipment case | 0.35 mgd average; 0.67 mgd design; two modules of 400 units | EPA fact sheet, 2021; Calls Creek example only |
Where solids-bearing flow requires upstream removal, the buyer can assess available pretreatment options such as a mechanical bar screen, but screening selection must follow the actual wastewater stream and debris characteristics. This assessment is not a substitute for completing the hydraulic and loading basis.
Size average, peak and equalization duties
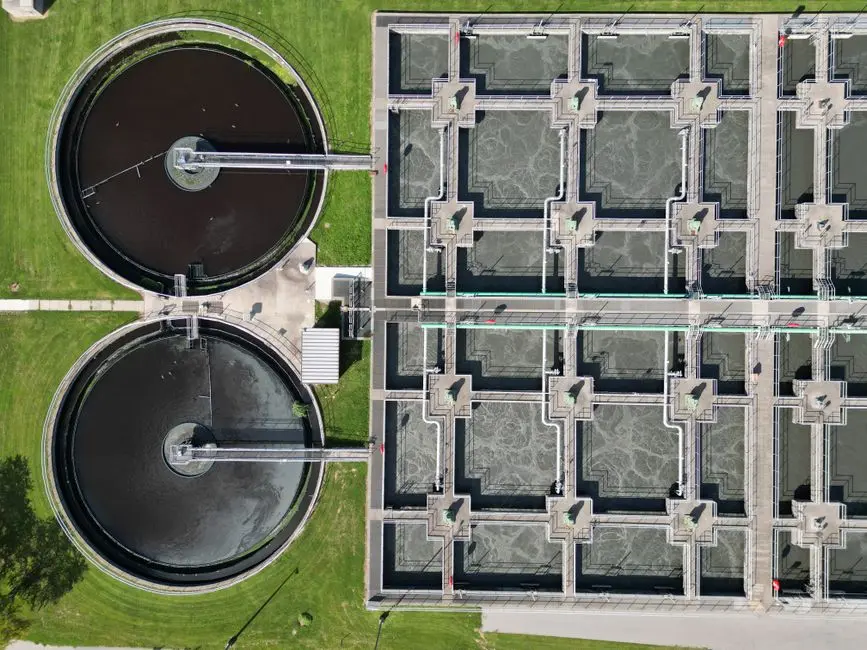
Calculate nominal MBR duty from the confirmed average wastewater flow remaining after upstream segregation, reuse and flow-reduction measures. For an industrial membrane bioreactor sizing worksheet, express the preliminary biological and membrane duties consistently in flow units and apply the selected design flux only after the treatment objectives and wastewater characteristics are confirmed. Keep average, peak, permitted and redundant capacity as separate entries to ensure quotations are comparable.
EPA’s Wastewater Management Fact Sheet, published by the U.S. Environmental Protection Agency in 2021, states that peak design flows should be no more than 1.5–2 times the average design flow. If the applicable peak exceeds that range, the same source directs designers to compare additional membranes with equalization. Equalization may be external in a dedicated basin or internal by maintaining additional depth in aeration and membrane tanks for later use.
The decision is not simply “membranes or equalization.” Additional membranes add installed capacity but require the supplier to demonstrate flux, fouling control and redundancy at the higher duty. Equalization changes the hydraulic profile and requires verified usable storage volume, controls and a return strategy. Both options must be evaluated against confirmed peak flow and the required treatment performance.
| Decision stage | Calculation or comparison | Required output |
|---|---|---|
| Nominal duty | Confirmed average MBR influent flow after segregation, reuse and flow reduction | Average treatment capacity, clearly labeled |
| Peak check | Compare confirmed peak flow with the average flow | Applicable peak-to-average ratio |
| EPA peak-response check | Compare the applicable peak with the EPA range of 1.5–2 times average flow | Document whether additional membranes or equalization are needed |
| Equalization check | Assess whether stored flow can be returned within the treatment system’s operating rules | Usable equalization volume and control basis |
| Redundancy check | Apply the selected N+1 arrangement to the defined operating duty | Installed, operating and maintenance scenarios |
The worksheet should preserve the distinction between nominal average treatment capacity, the capacity required at peak flow, the maximum permitted discharge flow and the installed capacity with redundancy. A supplier could otherwise quote equipment that meets only one of those conditions.
Confirm pretreatment and membrane-system configuration
EPA’s Wastewater Management Fact Sheet, published by the U.S. Environmental Protection Agency in 2021, states that all MBR systems require fine screens immediately before the membranes and specifies a 1- to 3-mm cutoff, depending on the manufacturer. The pretreatment design should remove debris and control membrane fouling, while the screen cutoff must match the selected membrane manufacturer’s requirements.
Primary treatment is often provided in larger installations but is not universally required, according to the same EPA fact sheet. Its inclusion should be justified by the confirmed wastewater characteristics, treatment objectives and selected process configuration. Required screening steps, accessible solids removal, cleaning frequency and the consequences of a fouling event should be identified before membrane-area calculations are accepted.
For a full-treatment installation, EPA recommends one additional membrane tank or unit beyond nominal design—the N+1 concept. That arrangement provides operating capacity during maintenance, but it does not remove the need to define the design flow, acceptable downtime and required treatment performance. EPA also identifies membrane location and configuration as design variables: submerged membranes sit in the biological reactor, while external membranes use a separate vessel; hollow-fiber bundles and flat plates have different screening requirements.
Compare submerged and external systems, and hollow-fiber or plate configurations, against the manufacturer’s screening, cleaning and replacement requirements. The integrated MBR membrane bioreactor system and DF series submerged MBR modules should be evaluated against the confirmed Ford duty, not treated as proof of capacity. For either configuration, show how the membrane area, design flux, biological loading and cleaning strategy produce the required effluent quality.
Issue a comparable MBR procurement package

Give every prospective supplier the same design inputs and quotation structure. Include confirmed average and peak flows, wastewater characterization, effluent requirements, required redundancy, pretreatment criteria, site constraints and applicable piping and electrical requirements. Require each response to show membrane area, design flux, train arrangement, N+1 provisions, equalization assumptions, cleaning strategy and replacement-module pricing.
The MBR product range of 10–2,000 m³/day is suitable only as an initial catalog screen. It cannot establish Ford’s requirement because the range does not substitute for confirmed flow, load, peak treatment, equalization or redundancy information. In the request, label each capacity consistently and ask suppliers to identify any capacity excluded by pretreatment, temperature, wastewater toxicity, membrane configuration or site constraints.
| Required quotation item | Supplier response required | Buyer check |
|---|---|---|
| Design duty | Average, peak, permitted and redundant capacities stated separately | Values use the same Ford design basis |
| Membrane calculation | Membrane area, design flux and operating assumptions | Calculation can be audited |
| Train arrangement | Installed units, operating units and N+1 provision | Maintenance scenario remains compliant |
| Equalization | Volume, controls and return assumptions, or a stated exclusion | Peak-flow conclusion is explicit |
| Pretreatment | Screen cutoff, solids removal and cleaning requirements | Criteria match the selected manufacturer |
| Commercial scope | Equipment, installation, commissioning, cleaning and replacement-module pricing | All bidders price the same scope |
| Membrane-life guarantee | Coverage for industrial service, spares and replacement pricing | Terms are specific and enforceable |
EPA’s 2021 fact sheet notes that membrane life affects cost-effectiveness and that guarantees are negotiated during procurement; it also reports that municipal guarantees may be more readily available than industrial guarantees. Use the industrial fab wastewater treatment guide to structure the package, but do not transfer another facility’s permit or operating basis to Ford.
Frequently Asked Questions
Why can’t the supplied evidence support a numeric MBR capacity for Ford’s Arizona EV plant?
No verified Ford wastewater flow, influent analysis, effluent limit or approved design basis is supplied. EPA identifies influent characteristics, effluent requirements and flow data as necessary MBR design inputs in its 2021 Wastewater Management Fact Sheet. A number without those inputs would be an invented capacity, not a defensible engineering estimate.
How will peak flow and N+1 redundancy change the MBR quotation?
Ask each bidder to distinguish nominal average capacity from peak treatment capacity and installed N+1 capacity. EPA’s 2021 fact sheet states that peak design flow should not exceed 1.5–2 times average design flow and says that higher peaks require additional membranes or equalization. Require the bidder to identify the flow basis, membrane area, design flux, operating-unit scenario and equalization exclusions for each quoted price.
What should buyers compare when evaluating different MBR configurations?
Compare the same process duty against membrane area and design flux, train arrangement, pretreatment requirements, cleaning strategy, maintenance access and replacement-module pricing. Include the membrane-life guarantee and verify whether it applies to industrial service and replacement modules. EPA’s 2021 fact sheet identifies screening, throughput, regular cleaning and guarantee terms as material to membrane life and cost-effectiveness.
How much will Ford’s MBR system cost, and which information is needed for a reliable price?
The supplied research provides no quotation for the Ford facility, so a defensible cost cannot be stated. Request a lump-sum equipment price and a separate installed-price breakdown covering pretreatment, tanks, piping, controls, electrical work, commissioning, equalization, cleaning chemicals, annual maintenance and replacement modules. The completed flow, characterization, permit-limit, duty and redundancy worksheet is required before bidders can price comparable systems.
What must Ford or its wastewater contractor verify before guaranteeing MBR capacity?
Verify the segregated flow balance, average and peak flows, wastewater characterization, discharge or reuse requirements, pretreatment assumptions, membrane flux basis, N+1 operating scenario and site constraints. The supplier’s guarantee should tie to those documented inputs and state what happens if actual flows or loads differ. Without that traceability, “capacity” may describe catalog equipment rather than the duty Ford must meet.