What Refinery Wastewater in London, Ohio Actually Has to Do
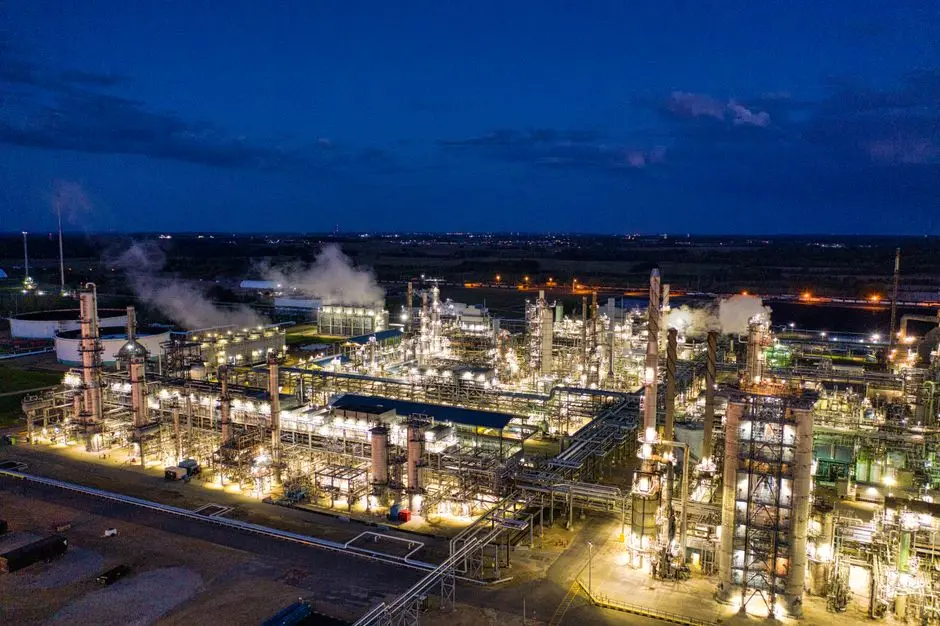
Refinery wastewater is not generic industrial wastewater, and the choice between a membrane bioreactor (MBR) and a conventional activated sludge (CAS) system hinges on the end-use of the treated water: discharge to a POTW, meeting a direct NPDES limit, or feeding a cooling-tower makeup loop. A typical London, Ohio refinery stream blends produced water, desalter brine, tank-bottom draws, spent caustic, and stormwater runoff, with temperatures ranging from 30–70 °C and a pollutant profile dominated by free and emulsified oil (often 50–500 mg/L), phenols (10–100 mg/L), PAHs, sulfides, and ammonia (20–80 mg/L) — peaks that routinely defeat a clarifier-based CAS train.
The regulatory envelope is 40 CFR Part 418 (the petroleum refining category under the EPA effluent limitations guidelines), the Ohio EPA NPDES permit framework, and Ohio Administrative Code 3745-31 for pretreatment and discharge. London, Ohio POTW pretreatment programs typically cap oil & grease at 100 mg/L and require under 50 mg/L oil for any on-site reuse intent. Reuse as cooling-tower makeup tightens the target further, with conductivity, silica, and free chlorine constraints that push designers toward RO polishing after biological treatment. The framing from Bertanza et al. (2017), cited in plant-wide MBR vs CAS studies, is direct: CAS wins on cost, MBR wins on effluent quality — and the decision turns on what the next downstream user of the water demands.
How MBR and CAS Treat Petroleum Wastewater Differently
Both technologies use the same front-end biology: an aerated basin where heterotrophic bacteria oxidize dissolved organics, and nitrifiers convert ammonia to nitrate. These systems diverge at the solids-separation stage. CAS relies on a gravity clarifier; the biomass must form a settleable floc, and a sudden FOG or surfactant surge from a desalter upset triggers bulking and washed-out solids. MBR replaces the clarifier with a submerged 0.1 μm PVDF ultrafiltration cassette, holding all biomass inside the reactor regardless of floc condition.
That physical barrier changes the operating envelope. Per the 2023 Membranes review (MDPI, Vol. 13, Issue 2, Article 181), MBR runs at higher SRT (typically 20–60 days vs 5–15 days for CAS), lower HRT (4–8 h vs 6–12 h), and lower observed sludge yield, because long SRTs drive more carbon to mineralization and less to new cells. The same review notes MBR is markedly more tolerant of recalcitrant compounds — the long-chain hydrocarbons and PAHs that survive a CAS clarifier are degraded across the extended SRT window.
On a plant-wide basis, Mannina et al. (2019) modeled both systems on the same influent and reported direct GHG emissions of 0.85 kgCO2eq/m³ for CAS and 0.91 kgCOeq/m³ for MBR — a near-tie on carbon footprint, with MBR's higher membrane-aeration energy offset by better solids capture. The same study framework notes MBR effluent microplastic counts of roughly 0.4 MP/L vs 1 MP/L for CAS, a gap that matters for any reuse permit review. For a refinery PFD, the MBR process flow diagram and P&ID reference shows the biological tank, membrane cassette, permeate pump, scour-air blower, and CIP skid that replace the CAS clarifier and sludge-wasting line.
MBR vs CAS on Refinery Effluent Quality, Footprint and Operability
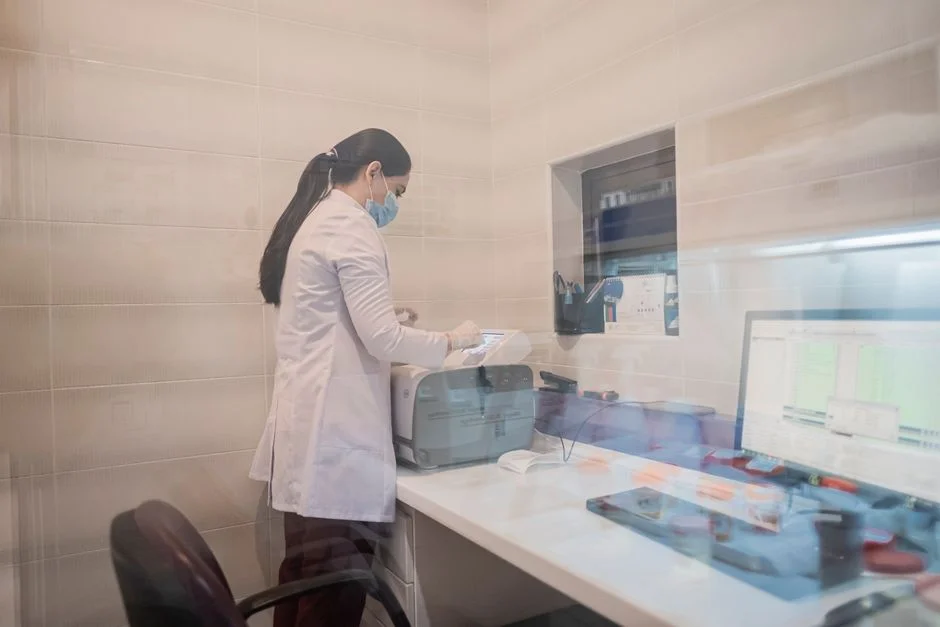
The table below consolidates the operating envelope an engineer needs for a 50–500 m³/day London, Ohio refinery case. Figures are consistent with the 2023 Membranes review and the Mannina et al. plant-wide model, with refinery-specific values drawn from the HydropureWater DF-series field data set.
| Parameter | CAS (refinery duty) | MBR (submerged PVDF, refinery duty) |
|---|---|---|
| Effluent COD | 60–100 mg/L | <50 mg/L (typical 30–45) |
| Effluent BOD₅ | 15–30 mg/L | <5 mg/L |
| Effluent TSS | 20–30 mg/L | <5 mg/L (typically <2) |
| Oil & grease in effluent | 5–15 mg/L (skimmer-dependent) | <2 mg/L (membrane barrier) |
| Ammonia (nitrified) | 2–8 mg/L (temperature-limited) | <1 mg/L at SRT > 25 d |
| SRT | 5–15 days | 20–60 days |
| HRT | 6–12 hours | 4–8 hours |
| MLSS | 2,500–4,500 mg/L | 8,000–12,000 mg/L |
| Footprint (10–2,000 m³/d) | Baseline | ~60% smaller (HydropureWater DF-series spec) |
| Sludge yield | 0.3–0.5 kg TSS/kg COD | 0.15–0.30 kg TSS/kg COD |
| Recurring maintenance | Clarifier sludge wasting, scum removal | Membrane CIP every 6–12 months; membrane life 5–8 years |
The operability gap varies by system configuration. CAS requires routine wasting and a working scum skimmer, but no membrane replacement. MBR demands a clean-in-place protocol, scour-blower redundancy, and operator familiarity with transmembrane pressure trends — but eliminates the clarifier failure mode that takes a refinery off-line during a slug load. For a refinery in or near London, Ohio with a constrained plot, the footprint difference is often the deciding layout factor; an integrated MBR skid for refinery duty at 200 m³/day fits inside a basin footprint that a CAS train cannot match.
London, Ohio Rules: NPDES Part 418 and Ohio EPA Pretreatment
40 CFR Part 418 sets the federal effluent limitations for the petroleum refining point source category. Subpart D covers petroleum refining, and the limits are set on a case-by-case basis under BAT/BCT/JCT considerations, with conventional pollutants (BOD, TSS, O&G), priority pollutants (phenols, chromium, ammonia), and pH all regulated. A typical Part 418 permit envelope for a small refinery discharging to a navigable water includes BOD₅ ≤ 30 mg/L, TSS ≤ 30 mg/L, O&G ≤ 10–15 mg/L, total phenols ≤ 0.3 mg/L, and ammonia limits tied to receiving-stream criteria. Ohio EPA implements these limits through individual NPDES permits and ties pretreatment programs to OAC 3745-31, which governs discharge to publicly owned treatment works.
For a London, Ohio refinery aiming at cooling-tower makeup reuse, the bar moves higher. Cooling-tower cycles of concentration demand low silica, low hardness, and tight conductivity control — effluent that an RO or NF polish can deliver only if the upstream biological step produces TSS consistently under 5 mg/L and COD under 50 mg/L. CAS with a polishing sand filter can sometimes reach the reuse envelope, but only on well-managed sites with steady loading. MBR effluent is the only practical path to reuse without an oversized RO polishing stage, and it provides a single unit operation to monitor rather than a clarifier-plus-filter train.
CAPEX and OPEX: A Refinery-Sized 2026 View
The cost effectiveness depends on the planning horizon. Per Karim and Mark (2017), MBR becomes the lower total-cost option over horizons longer than roughly 6–7 years because the high initial CAPEX is amortized by effluent-quality value and lower sludge disposal; over 10–20 year horizons typical of refinery capex planning, CAS has the lower total cost. Bertanza et al. (2017) found CAS cheaper on pure OPEX, MBR stronger on environmental and social scores, with the higher MBR energy tied to membrane scouring aeration.
For 2026 refinery-tuned ranges at 50–500 m³/day, the cost picture is as follows.
| Cost line | CAS (50–500 m³/d) | MBR (50–500 m³/d) |
|---|---|---|
| CAPEX (turnkey, USD) | $1.2M–$4.5M (new); retrofit lower if basin exists | $2.0M–$8.5M depending on capacity and prep |
| OPEX ($/m³ treated) | $0.25–$0.45 | $0.40–$0.75 (membrane energy + CIP chemicals) |
| Energy use (kWh/m³) | 0.4–0.8 | 0.7–1.4 (scour air dominant) |
| Membrane replacement | N/A | Every 5–8 years, ~15–25% of initial MBR CAPEX |
| Sludge disposal | Higher (more waste activated sludge) | Lower (lower yield at high SRT) |
| Reuse revenue / water offset | Limited without tertiary polish | Direct cooling-tower or boiler-feed reuse |
The reuse offset changes the financial calculation. A 200 m³/day refinery that reuses 70% of its treated effluent as cooling-tower makeup can offset $200,000–$400,000 per year in fresh-water purchase and sewer charges, which over a 15-year horizon closes most of the MBR CAPEX premium. For a deeper breakdown, the oil refinery wastewater treatment cost 2026 reference lays out process-level CAPEX and OPEX line items.
Specify MBR When… Specify CAS When…
The decision is binary if the engineer is honest about the downstream water demand. Specify an MBR — for example, a DF-series 0.1 μm PVDF flat-sheet MBR module — when the refinery needs cooling-tower or boiler-feed reuse, the site footprint is constrained (urban plot, tank-farm encroachment), FOG and emulsified-oil spikes are routine, or the design is future-proofing against tighter NPDES limits or a new zero-liquid-discharge policy. Specify CAS when the duty is discharge-only with no reuse target, an existing aeration basin has decades of useful life, and OPEX dominates the decision. A common hybrid at older US refineries is to keep the existing CAS for bulk BOD removal and add a polishing MBR stage before the reuse header — the cheapest path to reuse quality without scrapping the existing civil work.
Frequently Asked Questions
What effluent quality can an MBR reliably deliver on refinery wastewater compared with CAS?
On a refinery feed, MBR typically delivers COD under 50 mg/L, TSS under 5 mg/L, and oil & grease under 2 mg/L, versus CAS at 60–100 mg/L COD and 20–30 mg/L TSS, per the 2023 Membranes MDPI review. The membrane barrier eliminates the clarifier failure mode that drives CAS upsets during FOG slugs.
How much does an MBR cost per cubic meter treated for a 50–500 m³/day refinery?
For 2026 refinery-tuned ranges, MBR OPEX runs $0.40–$0.75/m³, with energy around 0.7–1.4 kWh/m³ driven by scour-air demand; CAPEX falls between $2.0M and $8.5M depending on capacity and pretreatment, as detailed in the
Frequently Asked Questions
Is MBR better than conventional activated sludge for refinery wastewater?
Membrane Bioreactor (MBR) systems generally outperform Conventional Activated Sludge (CAS) in refinery applications due to higher biomass concentrations, typically ranging from 8,000 to 15,000 mg/L of Mixed Liquor Suspended Solids (MLSS). This increased sludge age (SRT) allows for the degradation of complex hydrocarbons and recalcitrant organic compounds that often bypass standard secondary clarifiers.
Furthermore, MBRs eliminate the risk of sludge bulking and provide a superior physical barrier to suspended solids. In the context of stringent 2026 discharge standards, MBRs offer a smaller footprint and significantly higher process stability against the shock loading of chemical oxygen demand (COD) common in petroleum processing.
How much does an MBR cost for a small refinery in Ohio?
For a small refinery processing approximately 0.5 to 1.0 million gallons per day (MGD), capital expenditure for an MBR system typically ranges from $3.5 million to $6.0 million, depending on the complexity of the pre-treatment stages required for oil-water separation. This estimate includes membrane modules, aeration systems, and automated control logic.
Operational expenditures (OPEX) are generally 20-30% higher than CAS due to membrane scouring air requirements and periodic chemical clean-in-place (CIP) cycles. Energy consumption for these units typically falls between 0.8 and 1.5 kWh/m³ of treated water.
What effluent quality can an MBR achieve on oil and grease?
MBR technology is highly effective at removing free and emulsified oil and grease, consistently achieving effluent concentrations below 5 mg/L, and often reaching levels as low as 1-2 mg/L. This performance is achieved because the membrane pore size (typically 0.04 to 0.4 microns) physically rejects oil droplets that would otherwise escape a conventional secondary clarifier.
This level of treatment is sufficient to meet even the most rigorous local discharge requirements for refinery wastewater, effectively removing nearly all non-polar material that contributes to oil and grease measurements in standard EPA-approved testing methods.
Can a refinery retrofit an existing activated sludge basin with an MBR?
Yes, many refineries choose to retrofit existing aeration basins by installing membrane cassettes directly into the tanks or by converting them into membrane tanks. This approach allows for a capacity increase of 50% to 100% without the need for additional concrete structures, as the MBR process operates at much higher volumetric loading rates.
However, successful retrofitting requires an assessment of the existing aeration blowers, as MBRs require additional air for membrane scouring to prevent fouling. Upgrading the existing basin also necessitates the installation of a fine-screening system (typically 1-2 mm) to protect the membranes from debris and fibrous materials.
Does MBR help meet NPDES Part 418 limits for petroleum refining?
MBR systems are highly effective in ensuring compliance with 40 CFR Part 419 (Petroleum Refining Point Source Category) and associated NPDES permit limits. By providing a consistent barrier against total suspended solids (TSS) and effectively reducing Chemical Oxygen Demand (COD) and Phenols, MBRs ensure that discharge remains well within the federal effluent limitation guidelines.
Because MBRs produce an effluent with virtually zero turbidity, they are particularly advantageous for refineries facing tightened limits on heavy metals and trace organic pollutants that often associate with particulate matter. This makes them a primary technology choice for meeting the 2026 regulatory landscape in the United States.