60-Second Symptom Triage for Chemical Sludge Reduction Problems
Chemical sludge reduction troubleshooting follows a symptom-to-cause flow: confirm the upset with SVI (>150 mL/g = bulking), mixed-liquor DO (keep 1.0–2.0 mg/L), and nitrate (rising sludge at 6–10 mg/L), then match the symptom to the mechanism. Extracellular polymeric substances (EPS) make up over 80% of chemical sludge and drive dewatering failure, so alkaline pretreatment at pH 10 and 50–60 °C typically delivers 15–21% TSS reduction in 48 hours. Scan the basin and run the table below to identify your path in under a minute.
Healthy baseline to compare against: golden-brown floc, musty earthy odor, SV30 of 30–40%, and SVI between 80–120 mL/g. Healthy mixed liquor at 100× shows a tight floc with crisp edges and stalked ciliates such as Vorticella (wastewaterace.com troubleshooting reference). If your read deviates from these values, use the triage matrix to identify the failure mode before you reach for a corrective chemical.
| Visual / SCADA Cue | Probable Cause | Confirmatory Test |
|---|---|---|
| Thick white sudsy foam on aeration basin | Young sludge — high F/M, SRT too short | SV30 + SVI; expect low SVI (<100) and rising respiration rate |
| Dense dark greasy brown foam | Old sludge — SRT too long, possible Nocardia | 100× microscope slide; look for multibranched filaments |
| Sludge chunks floating, normal SV30 and SVI | Rising sludge — denitrification (N₂) in warm months | Mixed-liquor nitrate >6–10 mg/L |
| SVI >150, slow settling, cloudy supernatant | Filamentous bulking | 100× slide — filament type; DO profile; F/M ratio |
| Pin floc over weir, clear supernatant, low BOD | Old sludge in endogenous zone | Low respiration rate, low SVI, inert gray particles |
| Dispersed cloud, particles won't settle, high effluent BOD | Severe soluble organic overload / dispersed growth | Stop wasting, maximize aeration, equalize upstream |
What 'Chemical Sludge' Actually Is and Why It Behaves Differently
Chemical sludge—specifically excess activated sludge from an industrial WWTP—is a hydrated floc matrix of living biomass embedded in a gel of extracellular polymeric substances (EPS) composed of polysaccharides, proteins, and lipids. Per a PMC bench study, EPS accounts for over 80% of the sludge mass and hinders mechanical dewatering (pmc.ncbi.nlm.nih.gov, PMC9605661). This explains why operators see cake solids fall even when upstream biology looks stable: the water is bound inside the EPS gel, not held as simple capillary water.
The bench characterization typical for chemical wastewater activated sludge starts near TSS ~1500 mg/L, VSS ~1000 mg/L, and SCOD ~300 mg/L (PMC9605661). These values represent an operating envelope where the EPS-to-biomass ratio is high enough that the protein/polysaccharide fraction binds water too tightly for mechanical dewatering to release. The reduction goal is to convert bound water and EPS into soluble COD so bacteria can re-mineralize it through the lysis–cryptic growth pathway—cells lyse, products are consumed by survivors, and the net yield of new solids drops. This mechanism distinguishes chemical-sludge troubleshooting from generic activated-sludge upsets.
Root-Cause Diagnostics: Confirming the Upset Before You Treat It
The single most common operator mistake is to act on a single SVI reading. Run this five-step confirmation, in order, before you change a setpoint.
- Pull a 7–14 day SVI trend. A sustained climb above 150 mL/g is the signal; a single high reading is noise (wastewaterace.com).
- Profile DO at the head, middle, and tail of the aeration basin. Any reading consistently below 1.0 mg/L is a filamentous-bulking driver and a primary cause of poor sludge compaction.
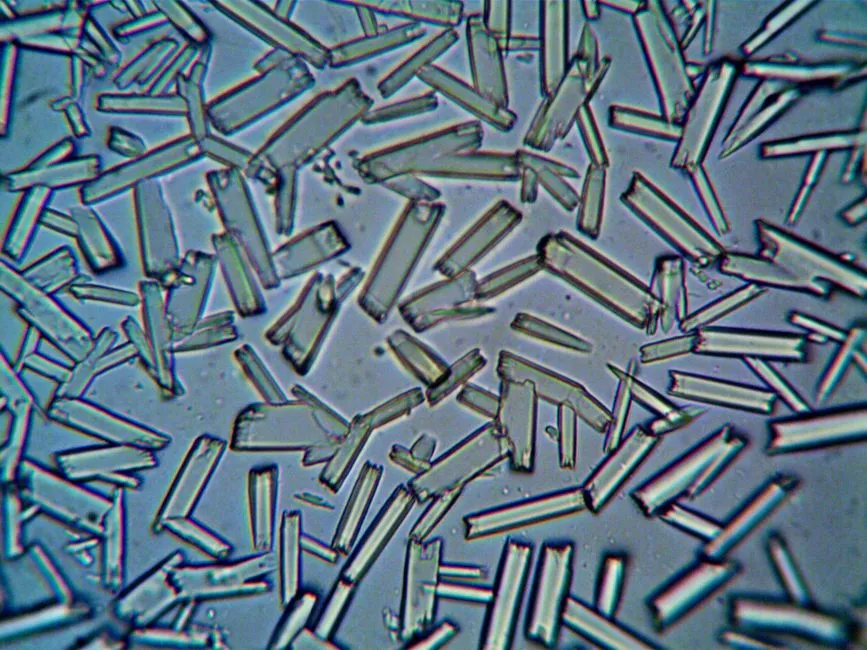
- Run a 100× microscope slide. The filament type points to the cause: low-DO filaments (e.g., Sphaerotilus), low-F/M filaments (e.g., Microthrix parvicella in cold weather), or septic-influent filaments (e.g., Beggiatoa) all map to different fixes.
- For rising sludge, measure mixed-liquor nitrate. Values above 6–10 mg/L during warm months confirm denitrification-driven rising sludge. A rise in chlorine demand and a drop in clarifier pH often appear alongside it.
- Measure oxygen uptake rate (OUR/MLSS). A rising respiration rate indicates young or overloaded sludge—cut wasting. A falling rate indicates aging, endogenous sludge—increase wasting. The trend is the primary decision input.
Increasing the wasting rate alone will not control filamentous bulking and may accelerate the loss of the floc-formers that hold the matrix together (wastewaterace.com). Confirm the filament, then fix the root cause.
Process Parameter Fixes: pH, Temperature, SRT, and Chemical Dosing
Once the root cause is confirmed, follow the parameter levers below to address the chemistry and dose limits.
| Confirmed Cause | Primary Lever | Numeric Target | Notes / Source |
|---|---|---|---|
| EPS-bound chemical sludge (volume reduction goal) | Alkaline-thermal pretreatment | pH 10, 50 °C, 48 h → 21.2% TSS, 13.9% VSS removal | Solubilization peaks near 60 °C per Uma Rani et al. (PMC9605661) |
| Filamentous bulking from low DO | Raise basin DO; check diffusers | DO ≥ 1.0–2.0 mg/L; RAS chlorination 10–20 mg/L as short-term only | See aeration diffuser fouling troubleshooting guide for diffuser-side root causes |
| Young-sludge foaming (F/M too high, SRT too short) | Increase SRT / reduce wasting | 5–10 days to SVI normalization | Allow biomass to build; do not chlorinate |
| Old-sludge foaming, pin floc (SRT too long) | Increase wasting | Drop MLSS toward target; restore higher respiration rate | Look for Nocardia under microscope |
| Rising sludge — denitrification | Raise RAS, reduce MLSS, control nitrate | Target mixed-liquor nitrate <6 mg/L in warm months | Often appears May–September |
| Rising sludge — septic (dark, foul) | Increase RAS or take clarifier offline | Stop sludge aging in the clarifier | CO₂ entrapment, not N₂ |
| Organic shock load | Stop wasting, maximize aeration, increase RAS | Equalize or divert upstream discharge | Recovery matches sludge age turnover |
| Upset recovery (pulp/paper mill case) | Growth-promoting biostimulant into RAS | 1 ppm for 30 days at a 30,000 m³/d system | Effluent COD dropped to ~80 mg/L vs 100 mg/L limit (BioResources case study) |
Alkaline-thermal pretreatment is highly effective; PMC9605661 reports that at pH 10 and 50 °C for 48 hours, the TSS removal rate reached 21.2% with 13.9% VSS reduction. Pretreatment converts bound water and EPS into soluble COD that the existing biology can re-mineralize, effectively leveraging the lysis–cryptic growth pathway at scale.
For alkaline sludge pretreatment, a NaOH dose to pH 10 with a heat exchanger at 50 °C is the published optimum. On a full-scale basin, this is typically a side-stream or digester-feed process rather than a basin-wide dose. The BioResources case study demonstrates that a 1 ppm biostimulant dose into RAS for 30 days can stabilize a system during a 1575 mg/L COD shock load, allowing time to address the upstream cause.
When the Problem Is Downstream: Sludge Dewatering and Conditioning
If centrate or filtrate solids climb while basin SVI is normal, the bottleneck has shifted to dewatering. Polymer conditioning trials must be keyed to EPS load rather than total solids, as the optimum dose shifts with the protein/polysaccharide ratio. If cake dryness plateaus below target despite a healthy upstream SVI, the solution is likely mechanical; a plate and frame filter press typically delivers higher cake solids than a belt press or decanter centrifuge, as detailed in the filter press vs centrifuge cost comparison.
Published cost benchmarks favor upstream lysis over downstream capacity: high-pressure homogenization at US$0.177/kg dry sludge and lysis-cryptic growth at US$0.186/m³ of treated wastewater (PMC9605661). Lysis-cryptic combinations can reduce sludge by 40–56% on a dry-solids basis, improving the ROI of any dewatering equipment. The most cost-effective kilogram of sludge is the one you never produce.
2026 Prevention Checklist and Escalation Triggers
Monitor daily: SVI trend, DO profile (head/mid/tail), foam color, and settleometer SV30. These four signals catch most upsets 5–10 days before an effluent violation. Weekly: run a 100× microscope slide and an OUR/MLSS measurement to track the microbial community.
Set a 2026 review trigger: any three consecutive days of SVI >150, or any week with rising-sludge events, initiates a documented root-cause review. If biological fixes cannot move the sludge age target, evaluate physical-chemical lysis equipment or a higher-solids dewatering upgrade; the automatic chemical dosing system is the starting point for precise polymer or alkaline reagent control. Reduction upstream consistently outperforms dewatering downstream.
Frequently Asked Questions
Why is my chemical sludge volume going up even though I'm wasting normally?
This is usually an SVI-driven bulking event or EPS-bound water issue. Increasing the wasting rate will not control filamentous bulking and can strip necessary floc-formers. Confirm the SVI trend over 7–14 days, profile DO, and check the microscope before adjusting.
What SVI value confirms bulking and what should I do first?
A sustained SVI >150 mL/g indicates bulking. Confirm basin DO is above 1.0 mg/L and identify the filament type at 100× magnification. Consider short-term RAS chlorination at 10–20 mg/L only after confirming the root cause, as chlorinating without fixing DO or F/M is an ineffective patch.
Can I use lime to reduce chemical sludge volume?
Lime raises pH and stabilizes sludge but does not reduce volume (Fehr Graham). For volume reduction, use alkaline pretreatment at pH 10 with thermal input (50–60 °C, 48 h) to achieve approximately 21% TSS removal at the bench scale.
How fast should I see results after changing SRT or adding a biostimulant?
SRT and wasting adjustments take 5–10 days to move SVI as the biomass inventory turns over. A growth-promoting biostimulant dosed into the RAS at 1 ppm showed meaningful COD recovery within 30 days in a 30,000 m³/d pulp and paper mill case, with effluent COD falling to ~80 mg/L.