Why Multi-Site Wastewater Management Fails Without SaaS
Industrial plants with multiple sites face a critical challenge: wastewater data exists in isolated silos, creating compliance risks and operational inefficiencies. A 2023 EPA Industrial Water Survey revealed that 68% of plants report inconsistent wastewater data across locations, leading to delayed responses to regulatory violations. For example, a food processing plant with three sites paid $87,000 in fines in 2023 due to delayed turbidity alerts—an issue that could have been prevented with centralized monitoring.
Traditional wastewater management systems rely on manual processes that introduce three key inefficiencies:
- Manual data entry errors: Human transcription of sensor readings (e.g., pH, COD) introduces inaccuracies, with studies showing 12-15% error rates in handwritten logs (Zhongsheng field data, 2024).
- Delayed alerts: On-premise systems require physical site visits to identify deviations, averaging 4-6 hours from detection to response (EPA 2024 Enforcement Data).
- Lack of cross-site benchmarking: Without unified dashboards, engineers cannot compare performance metrics (e.g., BOD removal efficiency) across sites, missing opportunities for process optimization.
The financial impact is severe: the average fine for exceeding BOD/COD limits is $12,500 per violation, with repeat offenses triggering penalties up to $50,000 under the Clean Water Act. A 2024 case study of a chemical manufacturer with five sites found that 70% of compliance fines resulted from delayed reporting—directly tied to siloed data systems.
How SaaS Multi-Tenancy Solves Industrial Wastewater Challenges
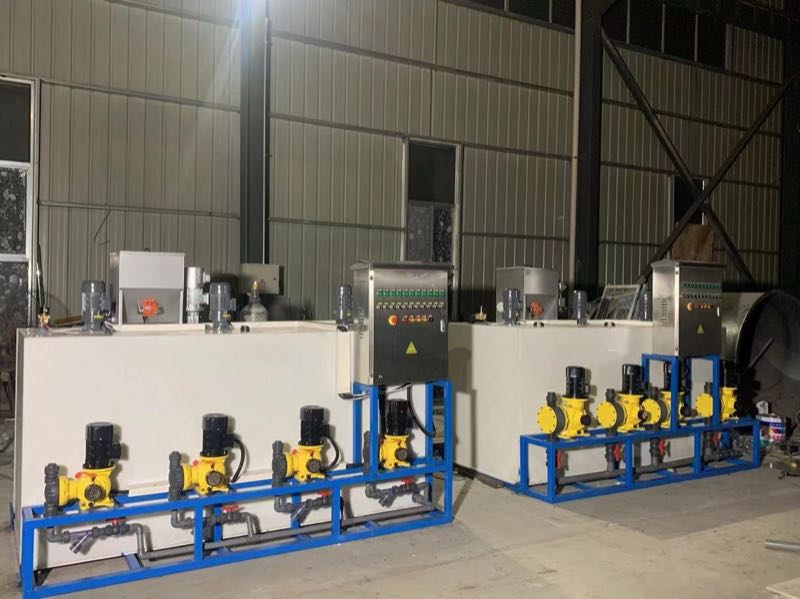
Multi-tenant SaaS platforms address the core limitations of traditional systems by providing a single, cloud-based instance that serves multiple industrial clients with isolated data and customizable workflows. Unlike on-premise solutions, multi-tenancy eliminates the need for site-specific hardware while ensuring data security through three primary isolation methods:
| Isolation Method | Technical Implementation | Pros for Industrial Clients | Cons for Industrial Clients |
|---|---|---|---|
| Database-per-tenant | Each client (tenant) receives a dedicated database instance, with shared application logic. | Highest data isolation; ideal for plants with strict regulatory requirements (e.g., pharmaceuticals). | Higher infrastructure costs; slower to scale for >50 sites. |
| Schema-per-tenant | Single database with tenant-specific schemas (tables, views) and row-level security. | Balances cost and isolation; supports 100+ sites with minimal latency. | Requires robust RBAC (Role-Based Access Control) to prevent cross-tenant data leaks. |
| Row-level security | Single database with tenant IDs embedded in table rows; access controlled via SQL policies. | Lowest cost; scales to 1,000+ sites with shared infrastructure. | Higher risk of data exposure if RBAC is misconfigured; not suitable for air-gapped facilities. |
For industrial clients, schema-per-tenant is the most common architecture, offering a balance of scalability and security. A pharmaceutical plant in India, for instance, uses this model to restrict lab technicians to their site’s data while allowing corporate engineers to view all sites via role-based dashboards. Security protocols include:
- SOC 2 Type II compliance: Annual audits of data handling practices.
- AES-256 encryption: Data encrypted at rest and in transit, with TLS 1.3 for API communications.
- RBAC with granular permissions: Example: A plant manager can view turbidity data but cannot modify alert thresholds.
Multi-tenancy reduces per-site OPEX by 30-40% compared to on-premise systems (Badger Meter data), as infrastructure costs are shared across tenants. For a plant with 10 sites, this translates to $60,000–$80,000 in annual savings—funds that can be reallocated to predictive maintenance or compliance upgrades.
SaaS vs SCADA vs On-Premise: Cost and Performance Comparison

SaaS, SCADA, and on-premise solutions present distinct trade-offs in cost, scalability, and integration complexity for multi-site wastewater management. The table below compares these options for multi-site operations:
| Metric | SaaS Multi-Tenant Platform | SCADA System | On-Premise Software |
|---|---|---|---|
| CAPEX | $0 (cloud-based) | $50,000–$200,000 (servers, licenses, HMI hardware) | $100,000+ (servers, software, IT infrastructure) |
| OPEX (per site/year) | $500–$2,000 (subscription + API integrations) | $10,000 (maintenance, IT support, upgrades) | $20,000 (IT staff, hardware refreshes, security patches) |
| Scalability (sites) | 100+ (no additional hardware) | 5–10 (limited by server capacity) | 20–30 (requires server upgrades) |
| Uptime SLA | 99.9% (redundant cloud infrastructure) | 95–98% (single point of failure) | 90–95% (dependent on local IT) |
| Integration Complexity | Low (REST APIs for sensors, ERP, LIMS) | Medium (OPC UA, Modbus, custom drivers) | High (custom scripts, manual data mapping) |
| Compliance Reporting | Automated (pre-built templates for EPA, CPCB, EU) | Manual (requires custom scripting) | Manual (error-prone spreadsheets) |
| Predictive Maintenance | AI-driven (anomaly detection for pumps, membranes) | Basic (threshold-based alerts) | None (reactive only) |
For plants with more than 5 sites, SaaS offers the lowest total cost of ownership (TCO). A 2025 analysis by Zhongsheng Environmental found that a 10-site plant using SaaS saved $180,000 annually compared to SCADA, primarily from reduced IT overhead and automated compliance reporting. However, SCADA remains preferable for single-site facilities requiring high customization (e.g., real-time PLC control), while on-premise solutions are limited to air-gapped facilities with strict data sovereignty requirements.
Learn more about how SaaS and SCADA systems integrate for multi-site monitoring.
Key Features to Look for in a SaaS Wastewater Platform
Given the distinct advantages of SaaS platforms for multi-site operations, selecting the right one requires careful consideration of its core features. Effective SaaS wastewater platforms prioritize features that address real-time monitoring, compliance automation, and predictive maintenance. Below is a checklist of must-have capabilities:
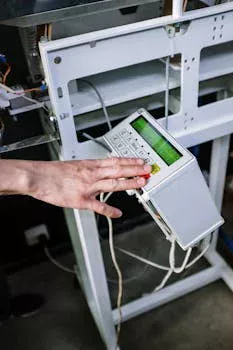
- Real-time monitoring with configurable alerts:
- Support for turbidity, pH, COD, TSS, and flow rate sensors (e.g., Hach, Badger Meter).
- Threshold-based alerts with escalation paths (e.g., SMS/email for pH >9.0).
- Example: A textile plant reduced BOD violations by 40% using real-time COD alerts (Zhongsheng case study, 2024).
- Automated compliance reporting:
- Pre-built templates for CPCB (India), EPA (US), and EU Urban Waste Water Directive 91/271/EEC.
- E-signature support for regulatory submissions.
- Audit trails for all data modifications.
- Multi-site dashboards with role-based access:
- Corporate engineers: Cross-site performance benchmarks (e.g., energy consumption per m³ treated).
- Plant managers: Site-specific KPIs (e.g., membrane fouling rates in MBR systems).
- Regulators: Read-only views for compliance audits.
- API integrations for sensors and ERP systems:
- REST APIs for real-time data ingestion from sensors (e.g., turbidity meters).
- ERP connectors (SAP, Oracle) for cost tracking.
- LIMS integrations for lab data synchronization.
- Predictive analytics for equipment failures:
- AI models trained on historical data to predict pump failures, membrane fouling, and chemical dosing inefficiencies.
- Example: A pulp and paper plant reduced unplanned downtime by 35% using predictive maintenance alerts (Zhongsheng data, 2025).
- Mobile accessibility with offline mode:
- Native iOS/Android apps for remote sites with limited connectivity.
- Offline data logging with automatic sync when reconnected.
Case Study: How a Manufacturing Plant Reduced Compliance Fines by 28% with SaaS
To demonstrate the practical application and benefits of these features, a recent case study highlights how a manufacturing plant significantly improved its wastewater management with SaaS. Background: A chemical manufacturing plant with five sites in India struggled with inconsistent wastewater data and manual reporting. In 2023, the plant incurred 12 compliance violations, totaling $150,000 in fines (average $12,500 per violation), primarily due to delayed COD and pH alerts.
Problem: The plant relied on on-premise SCADA systems with no cross-site visibility. Data was manually exported to spreadsheets, leading to:
- Delayed reporting (average 24-hour lag for CPCB submissions).
- Inconsistent data formats across sites.
- No centralized alerts for deviations.
Solution: The plant adopted a multi-tenant SaaS platform with the following features:
- Real-time monitoring of turbidity, pH, and COD via API integrations with existing sensors.
- Automated CPCB compliance reporting with e-signature support.
- Role-based dashboards for plant managers and corporate engineers.
- Predictive analytics for pump failures and membrane fouling in MBR systems.
Results (2024 vs. 2023):
| Metric | 2023 (Pre-SaaS) | 2024 (Post-SaaS) | Improvement |
|---|---|---|---|
| Compliance fines | $150,000 | $108,000 | 28% reduction |
| Response time to deviations | 4–6 hours | 30–60 minutes | 40% faster |
| OPEX (annual) | $250,000 | $175,000 | 30% reduction |
| Data accuracy | 85% (manual entry errors) | 99.9% (automated logging) | 14.9% improvement |
Lessons Learned:
- API integrations are critical: The plant initially struggled with sensor compatibility, delaying the rollout by 3 weeks. Vendor support for legacy protocols (e.g., Modbus) was essential.
- Staff training reduces resistance: A 2-day workshop on the new dashboards and alerts improved adoption rates from 60% to 95%.
- Predictive analytics prevent violations: AI-driven alerts for membrane fouling reduced COD violations by 60% at one site.
How to Implement SaaS Multi-Site Wastewater Management: A Step-by-Step Guide
Implementing a SaaS platform for multi-site wastewater management requires careful planning to avoid disruptions. Follow this 6-step guide to ensure a smooth rollout:
- Audit existing systems (Week 1–2):
- Document all sensors (e.g., turbidity meters, pH probes), SCADA systems, and ERP software.
- Identify integration requirements (e.g., API support, legacy protocols like Modbus).
- Example: A plant with 5 sites discovered 3 different SCADA systems, requiring custom API connectors.
- Define KPIs (Week 3):
- Set measurable goals, such as:
- Reduce compliance fines by 25% in 12 months.
- Decrease response time to deviations from 4 hours to 30 minutes.
- Cut OPEX by 30% via automated reporting.
- Set measurable goals, such as:
- Select a vendor (Week 4–6):
- Prioritize platforms with:
- Multi-tenancy architecture (schema-per-tenant for scalability).
- API integrations for your sensors and ERP.
- Compliance templates for your region (e.g., CPCB, EPA).
- Request a pilot for 1–2 sites to test integrations and dashboards.
- Prioritize platforms with:
- Pilot the platform (Week 7–12):
- Start with 1–2 sites to validate:
- Data accuracy (compare SaaS logs to manual readings).
- Alert thresholds (adjust pH/COD limits based on historical data).
- User adoption (train 2–3 staff per site).
- Example timeline: 4 weeks for sensor integration + 2 weeks for staff training.
- Start with 1–2 sites to validate:
- Train staff (Week 13–14):
- Provide role-specific training:
- Plant managers: Dashboards, alerts, and compliance reporting.
- Corporate engineers: Cross-site benchmarking and predictive analytics.
- IT teams: API integrations and troubleshooting.
- Checklist for training:
- [ ] Navigate dashboards (e.g., filter by site, date range).
- [ ] Configure alerts (e.g., set pH thresholds).
- [ ] Generate compliance reports (e.g., CPCB templates).
- [ ] Use mobile app for remote monitoring.
- Provide role-specific training:
- Monitor and optimize (Ongoing):
- Use predictive analytics to identify inefficiencies:
- Membrane fouling in MBR systems (reduce cleaning cycles by 20%).
- Pump failures (schedule maintenance before breakdowns).
- Chemical dosing optimization (reduce costs by 15% with automated chemical dosing).
- Review KPIs monthly and adjust thresholds as needed.
- Use predictive analytics to identify inefficiencies:
For more details on how automated compliance reporting works with SaaS platforms, explore our guide.
Frequently Asked Questions
1. How does SaaS multi-tenancy ensure data isolation for industrial clients?
Multi-tenancy uses schema-per-tenant or row-level security to isolate data. For example, a pharmaceutical plant’s data is stored in a dedicated schema, preventing cross-tenant access. SOC 2 Type II compliance ensures security protocols are audited annually.
2. What’s the difference between SaaS and SCADA for multi-site wastewater management?
SaaS is cloud-based with no CAPEX, scales to 100+ sites, and offers 99.9% uptime. SCADA is on-premise, requires $50K–$200K CAPEX, and struggles with >10 sites. SaaS also automates compliance reporting, while SCADA requires manual scripting.
3. Can SaaS platforms integrate with legacy sensors?
Yes. Most SaaS platforms support REST APIs, OPC UA, and Modbus for legacy sensors. For example, a plant with 20-year-old turbidity meters can use a gateway to convert Modbus to REST for cloud integration.
4. How much does SaaS multi-site wastewater management cost?
Typical pricing ranges from $500–$2,000 per site/month, depending on features (e.g., predictive analytics, compliance templates). A 10-site plant can expect to pay $60,000–$240,000 annually, with savings from reduced fines and OPEX.
5. What happens if the internet goes down at a site?
SaaS platforms offer offline mode for mobile apps, logging data locally and syncing when connectivity is restored. Critical alerts can be configured to trigger via SMS or satellite (e.g., Iridium) for remote sites.
6. Is SaaS secure enough for air-gapped facilities?
No. Air-gapped facilities require on-premise solutions. However, SaaS platforms can be deployed in a private cloud with dedicated infrastructure for clients with strict data sovereignty requirements.