Why Plastic Manufacturing Wastewater Stalls Conventional Treatment
Plastic and polymer plants typically discharge an effluent that looks nothing like a textbook municipal stream. COD routinely sits between 800 and 3,000 mg/L, color is persistent, and the dissolved fraction carries plasticizers (phthalates, adipates), antistatic agents, residual monomers such as styrene, vinyl chloride, acrylates, methyl methacrylate and caprolactam, plus non-ionic and anionic surfactants from cleaning-in-place operations. Stable polymer colloids and fines from extrusion wash water add a suspended fraction that resists settling. The biological step — usually activated sludge or MBR — is sized for a general organic load and runs adequately for 60–70% COD removal on the readily biodegradable fraction, but it stalls on the recalcitrant tail.
Three mechanisms drive that stall. First, monomer and solvent spikes from batch reactors create shock loads that depress biomass specific activity. Second, wash water from extrusion lines often exits above 40°C, and biomass activity drops measurably above that threshold. Third, biofilm toxicity builds up around phenol-formaldehyde residues, formaldehyde, and amine catalysts. The result is stable bio effluent with COD in the 250–500 mg/L range that still fails discharge limits and contains the color and surfactant load a municipal plant will reject at the receiving end.
An advanced oxidation process is normally deployed as a tertiary polishing step after primary clarification, a DAF system or an MBR system. This positioning matters for CAPEX framing: AOP polishes what biology cannot finish, rather than replacing biology. As a reference benchmark, the KIWST 2024 study on tertiary municipal wastewater reported 62.0% TOC and 77.0% CODcr removal for O3+H2O2 against 59.3% TOC for ozone alone, which sets a realistic improvement ceiling an engineer should expect when adding AOP to a working bio step (Korean Society of Water Science and Technology, 2024).
How AOP Works in a Plastic Plant Context
Advanced oxidation processes generate hydroxyl radicals (·OH) as the primary oxidant, with a standard electrode potential near 2.8 V. Hydroxyl radicals attack dissolved organics non-selectively and mineralize a portion of them to CO2, water, and short-chain organic acids, while partially oxidizing the rest into more biodegradable intermediates.
Four commercial AOP variants dominate plastic and polymer plant upgrades: ozonation (O3 alone), ozone combined with hydrogen peroxide (O3/H2O2), UV combined with hydrogen peroxide (UV/H2O2), and photo-Fenton (Fe2+/H2O2/UV). Engineers select these systems based on radical yield rather than oxidant dose. Higher ·OH production per gram of oxidant means less H2O2 or O3 consumed per kilogram of COD destroyed, which drives OPEX more than the headline removal percentage.
Three influent parameters control radical yield, and they all show up in plastic streams. pH outside the 7–9 band collapses ·OH lifetime; carbonate and bicarbonate alkalinity scavenge radicals and convert them to less reactive carbonate radicals; chloride and bromide from acid pickling, chrome plating rinses, and cooling-tower blowdown act as radical sinks. Suspended polymer fines and color bodies absorb UV in UV-based systems and shield the bulk liquid from photon flux. For a plastic plant with high chloride or high TSS upstream of AOP, this radical quenching is the dominant design constraint.
AOP Process Matrix for Plastic Manufacturing Wastewater
The table below is a screening tool for shortlisting processes before jar testing; the numbers are typical engineering envelopes drawn from published studies and equipment vendor data.
| Process | Typical pH window | Strength for plastic streams | Weakness | Indicative relative oxidant cost |
|---|---|---|---|---|
| Ozonation (O3 alone) | 7–9 | Simple skid, no peroxide storage; good for decolorization and surfactant breakdown | Lower COD removal — 59.3% TOC in KIWST 2024; bromate risk if rinse water contains bromide | Low to moderate (power-bound) |
| O3/H2O2 | 7–9 | KIWST 2024 benchmark: 62.0% TOC and 77.0% CODcr; default choice for COD >1,000 mg/L plastic streams | H2O2 storage and dosing; off-gas destruction required; chloride quenching above ~1,000 mg/L Cl⁻ | Moderate (H2O2 purchase dominates) |
| UV/H2O2 | 6.5–8.5 | No ozone off-gas handling; effective on low-color, low-TSS effluent; containerized UV skid shortens installation (enviolet product data, 2025-08) | Lamp sleeve fouling from polymer fines; color and TSS compete for UV photons; mercury or LED lamp replacement OPEX | Moderate to high (electrical energy + lamps) |
| Photo-Fenton (Fe2+/H2O2/UV) | 2.5–4 (acidic) | Aggressive on high-COD, low-pH streams; iron is often already on site from pickling baths | pH adjustment to acidic then re-neutralization; Fenton sludge handling; UV lamp scaling from iron hydroxide | High (iron salt + sludge disposal) |
In practice, a polymer compounding plant with clear bio effluent and pH 7–9 typically lands on O3/H2O2, while a polyester plant with acidic condensates tends toward photo-Fenton. A plant with no off-gas handling permits and tight footprint constraints falls back to UV/H2O2. The matrix will not replace a bench test on real effluent.
Sizing the AOP Skid: Dose, Contact Time and Reactor
The KIWST 2024 O3+H2O2 result provides a preliminary benchmark to design for 60–80% CODcr removal on bio effluent. For ozone-based systems, the standard design variable is specific ozone dose, expressed in grams of O3 applied per gram of COD removed — typical envelopes fall in the 1.0–3.0 g O3/g COD range for the high-COD plastic polishing case. H2O2 is dosed in a 0.3–1.0 mass ratio to applied O3. For UV/H2O2 systems, UV dose is expressed in mJ/cm² (fluence), with typical design envelopes in the 500–2,000 mJ/cm² range depending on color and TSS.
Before procurement, run bench-scale jar tests on real plant effluent plus a pilot column sized at 1–5% of full flow. enviolet's product literature (2025-08) describes FAT testing of AOP skids and remote monitoring as standard practice on containerized units. A pilot run also resolves the chloride and alkalinity quenching question that a desktop study cannot.
Three hydraulic constraints consistently show up on plastic plant AOP installations. First, contactor retention time of 20–60 minutes is typical, with back-mix reactors preferred over plug-flow for ozone systems. Second, off-gas from the ozone contactor must be thermally or catalytically destroyed to below 0.1 ppmv before venting. Third, any UV-based AOP needs fine screening (typically 500 µm or finer) upstream to keep polymer fines off the lamp sleeves. Containerized AOP skids shorten 2026 site installation to weeks rather than months.
Pretreatment and Integration with the Existing Plant
Feed condition determines AOP performance more than oxidant selection. Position AOP after a DAF system for plastic plants generating free oil and floating polymer, or after an MBR system when the bio step is already removing the bulk of dissolved COD. DAF removes floating polymer chunks and oils that would otherwise load the AOP with non-target material; MBR handles dissolved COD and provides a low-TSS feed that lets the AOP run at its design fluence. Trying to polish raw or poorly settled wastewater through AOP is the most common cause of an under-performing tertiary install.
For UV-based AOP, add a fine bar screen or rotary screen upstream of the lamp rack to prevent polymer-fine fouling of the quartz sleeves. pH adjustment is a design line item: most AOPs run best at pH 7–9, and acidic extrusion condensates will need neutralization. The neutralization chemistry should be integrated with an automatic chemical dosing system tied into the PLC, as described in the automated chemical dosing architecture guide. Iron salt, H2O2, acid and NaOH dosing should run from a single control layer with redundant interlocks. For polymer plants specifically, an upstream equalization basin of 12–24 hours is often the most effective upgrade available for smoothing monomer spikes.
2026 Cost Envelope, OPEX Drivers and ROI Logic
Three cost buckets dominate an AOP retrofit: oxidant (O2 feed and power for ozone generation, plus H2O2 purchase), energy (UV lamps, ozone generators, blowers, cooling), and consumables (catalyst where used, pH adjusters, lamp replacement, Fenton sludge handling). The dominant OPEX driver is process-dependent.
| Process | Dominant OPEX line | Secondary line | Typical driver to watch in 2026 |
|---|---|---|---|
| Ozonation (O3 alone) | O2 feed + generator power | Off-gas system power | Tariff on industrial oxygen, electricity price |
| O3/H2O2 | H2O2 purchase | Generator power, H2O2 storage | H2O2 unit price (correlated with freight and energy) |
| UV/H2O2 | Lamp replacement + electrical energy | H2O2 purchase | Lamp life, electricity price, sleeve cleaning frequency |
| Photo-Fenton | Iron salt + sludge disposal | UV lamp power, pH adjusters | Iron salt unit cost, sludge hauler gate fee |
The defensible CAPEX framing for a retrofit committee is that AOP capital and operating costs are typically lower than a full chemical-physical treatment train. Translate that into ROI math: cost per kilogram of COD removed, multiplied by kilograms of COD removed per day, benchmarked against the sewer surcharge or the avoided freshwater purchase cost for a reuse application. Exact figures must be filled from the plant's own tariff and vendor quotes.
Worked Selection Example: Choosing AOP for a Polymer-Compounding Plant
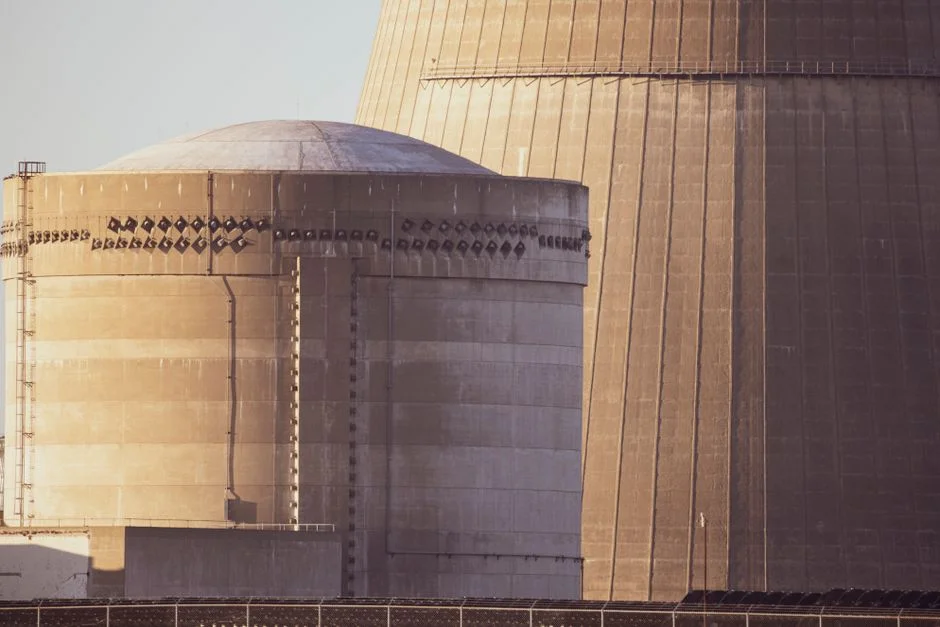
A 500 m³/d polymer compounding plant with an influent COD of 1,800 mg/L and residual COD of 540 mg/L requires tertiary treatment to meet a 500 mg/L discharge limit. Given the bio residual contains surfactants and color bodies, the pH is stable at 7–9, and chloride levels are low, O3/H2O2 is the most practical choice. KIWST 2024 reports 77.0% CODcr removal on a similar tertiary stream, providing enough headroom to meet the 500 mg/L sewer limit with margin. UV/H2O2 acts as a fallback if off-gas handling is restricted by site permitting. Every project needs jar testing on actual plant effluent before any procurement commitment, and the dose ranges provided are starting points.
Frequently Asked Questions
What removal efficiency can O3/H2O2 realistically achieve on plastic plant bio effluent?
The KIWST 2024 study on tertiary municipal wastewater reported 62.0% TOC and 77.0% CODcr removal for O3+H2O2. For a plastic bio effluent with pH 7–9 and low chloride, a 60–80% CODcr removal band on the bio residual is a defensible design target.
Is UV/H2O2 or ozone better for a plastic plant without off-gas handling permits?
UV/H2O2 is the practical choice when ozone off-gas destruction is not feasible. The trade-off is lamp sleeve fouling from polymer fines and color bodies, which requires fine screening upstream of the lamp rack and regular sleeve cleaning. enviolet's containerized UV-Oxidation AOP units are designed for this service profile (enviolet.com, accessed 2026).
Where should AOP be placed in an existing plastic plant treatment train?
Position AOP as a tertiary polishing step after a DAF system for free oil and floating polymer, or after an MBR system when dissolved COD removal is needed before polishing. AOP is not a stand