Industrial water scarcity solutions that plants can deploy
Industrial water scarcity solutions combine intake reduction, wastewater reuse, closed-loop recycle, and resource recovery so plants keep running when freshwater is constrained. Typical programs cut freshwater use by 30–70% by sector; closed-loop trains often reach 80–95% intake reduction when water quality targets are met.
Industry withdraws about 22% of global freshwater, while 2.7 billion people face scarcity at least one month each year. Textile dyeing uses 200–300 L/kg fabric. Food and beverage plants often need 3–5 L water per liter of product. Mining can use 1–2.5 m³ per ton of ore. U.S. industrial withdrawals average 14.8 billion gallons per day, with about 60% from freshwater sources.
During shortages, plants see supply cuts, water cost jumps of 20–50%, and tighter discharge enforcement. The World Bank estimates scarcity could cut regional GDP by up to 6% by 2050. Once-through cooling can waste about 95% of intake water. Leaks commonly account for 10–30% of industrial water loss. Pairing treatment with industrial water footprint reduction strategies is how most plants we size move from conservation slogans to measurable m³/d savings.
Regulatory pressure reinforces the same engineering path. The EU Industrial Emissions Directive and China Water Pollution Prevention and Control Law already push reuse rates of 30–50% in selected industries. U.S. EPA Effluent Limitation Guidelines keep BOD, TSS, metals, and nutrients under numeric caps. Semiconductor fabs can lose 2–3 million gallons per year to leaks alone. Dairy plants often discharge 1–2 liters of wastewater per liter of milk processed—volumes that become cooling or wash water after proper treatment. Field surveys we run before quoting usually show cooling and wash water as the first reuse candidates, while boiler and product-contact streams need a stricter polish stage.
What sustainable solutions reduce industrial water waste?
Sustainable solutions that reduce industrial water waste start with a water audit, then rank Reduce, Reuse, Recycle, and Recover by cost per cubic meter saved. Source reduction is usually cheapest. Reuse and recycle follow. Resource recovery adds value when organics, nutrients, or metals are concentrated enough to monetize.
According to a 2025 industrial water management framework aligned with Water Environment Federation practice, these four pillars can cut industrial water use by 30–70% depending on the sector. Most plants we size for food, textiles, or chemicals run first at the lower end until meters, leak repair, and cooling upgrades are in place.
Reduce intake. Replacing once-through cooling with closed-loop chillers can cut water use by 40–60%. A German steel mill cut use by 50% with air-cooled condensers on blast furnaces. Acoustic leak detection prevents losses of 10–30% of intake; one California food plant saved 1.2 million gallons per year. Dry cleaning and dry machining remove water from selected process steps entirely.
Reuse non-potable streams. Treated effluent can supply cooling-tower makeup, equipment wash, and irrigation. Pre-treatment with DAF for industrial wastewater pre-treatment plus MBR systems for water reuse is a common path. A Dutch brewery reuses 90% of wastewater for bottle washing and cooling after MBR and reverse osmosis. An Indian textile dye house cut freshwater intake by 65% by rinsing with treated effluent.
Recycle in closed loops. Reverse osmosis recovers 75–95% of feed as permeate for boiler or high-purity duty, depending on feed salinity and energy recovery. Ion exchange removes hardness and silica for cooling and steam. Electrodeionization produces high-purity water without chemical regenerant when polishing RO permeate.
Recover value from wastewater. Anaerobic digestion of food-process organics can offset 20–40% of plant energy via biogas. An Idaho potato plant recovers about one ton of struvite fertilizer daily. Electrochemical systems reclaim copper, nickel, or zinc at 90–99% recovery rates when metal concentrations justify the train.
Advanced technologies for industrial water reuse and treatment
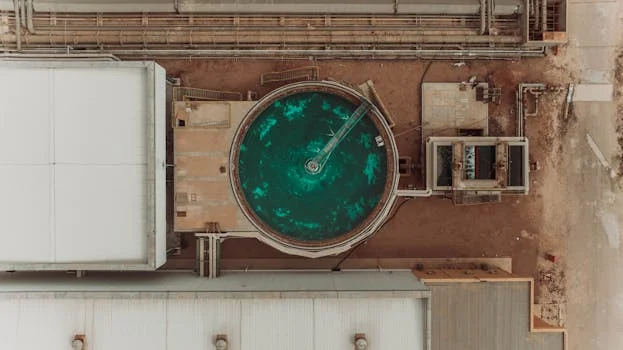
Technology choice for industrial reuse depends on feed quality, the reuse specification, and lifecycle cost—not on a single unit operation. The table below keeps the performance ranges plants use for screening MBR, RO, DAF, packaged clarification, and ClO₂ disinfection.
| Technology | Key Features | Typical Applications | Performance Metrics | Limitations |
|---|---|---|---|---|
| Membrane Bioreactor (MBR) |
|
|
|
|
| Reverse Osmosis (RO) |
|
|
|
|
| Dissolved Air Flotation (DAF) |
|
|
|
|
| Integrated Water Purification (JY Series) |
|
|
|
|
| Chlorine Dioxide (ClO₂) Generators |
|
|
|
|
Typical wastewater-to-reuse train (food plant, cooling makeup). Screening at 1–5 mm mesh removes coarse solids. DAF for industrial wastewater pre-treatment then targets FOG and TSS to below 50 mg/L. An MBR stage drives BOD below 5 mg/L and TSS below 1 mg/L. Industrial RO for ultra-pure water polishes dissolved salts to TDS below 10 mg/L when the reuse duty needs it. ClO₂ generators for water disinfection finish microbial control toward 0 CFU/100 mL before storage. For a 100 m³/h plant, this layout often cuts freshwater intake by about 90% with a 3–5 year payback when local water and discharge fees are mid-range.
Which treatment trains support high-purity water reuse?
High-purity industrial reuse trains almost always place solids and organics removal ahead of RO so membranes see stable SDI and low FOG. RO fits when the reuse duty needs TDS below about 10 mg/L, silica control for boilers, or rinse water for electronics. It is the wrong first unit for raw food effluent still carrying FOG and TSS—DAF and MBR belong upstream. Brine disposal, antiscalant dose, and recovery set between 75% and 95% decide whether RO pays back on a given site.
Implementing closed-loop water systems in manufacturing
Closed-loop water systems treat and return wastewater inside the same facility, cutting freshwater intake by 80–95% when quality setpoints are held. Design starts from the reuse specification, then works backward through contaminant removal and chemical control. For layout detail, see our guide on designing closed-loop water systems.
Water quality setpoints plants actually size to. Cooling towers commonly need TSS below 10 mg/L and hardness below 50 mg/L as CaCO₃. Boiler feed often needs TDS below 1 mg/L and silica below 0.02 mg/L. Semiconductor rinse water may require particles larger than 0.1 μm below 10 counts/mL. Miss the setpoint and fouling or product defects erase the water savings.
Match contaminants to unit operations.
| Contaminant Type | Example Industries | Treatment Technologies |
|---|---|---|
| Suspended solids (TSS) | Pulp and paper, food processing | DAF, sedimentation, filtration |
| Dissolved organics (BOD/COD) | Textiles, pharmaceuticals | MBR, activated sludge, advanced oxidation |
| Dissolved salts (TDS) | Chemicals, mining | RO, ion exchange, electrodialysis |
| Heavy metals | Metal finishing, electronics | Chemical precipitation, ion exchange, electrochemical recovery |
| Microbes | Food and beverage, healthcare | UV, ClO₂, ozone, membrane filtration |
Automated coagulant dosing cut chemical use 30% at a Bangladeshi textile plant, saving about $50,000 per year. A Wisconsin dairy raised RO recovery from 75% to 90% with better antiscalant control. A Belgian brewery combining DAF, MBR, and RO reused 95% of wastewater and cut freshwater intake by 1.5 million m³ per year, with discharge fees down about $200,000. A Turkish dye house treating 1,200 m³/d at 85% reuse paid back in four years. A Mexican metal-finishing plant recovered 99% of nickel and cut water use 90%, saving about $150,000 per year in water and chemicals.
Cost benchmarks for closed-loop trains. Capital often lands at $1,500–$4,000 per m³/day of capacity by technology and industry. Operating cost commonly runs $0.50–$2.00 per m³ treated for energy, chemicals, labor, and maintenance. Payback typically spans 2–7 years. Water savings of 80–95% of freshwater intake are realistic when reuse quality holds. These programs scale best when meters, permits, and brine outlets are fixed before equipment purchase.
Measuring success: benefits and ROI of industrial water programs
Industrial reuse projects show returns across water bills, discharge fees, compliance risk, and uptime. Data from 50+ industrial installations supports the ranges below; local tariffs move the dollars more than the percentages.
Closed-loop systems that cut freshwater intake by 80–95% can save $50,000–$500,000 per year for a 100 m³/h plant when water costs $1–$5 per m³. Reusing 90% of wastewater can trim discharge fees by 70–90%, or about $20,000–$200,000 per year at many manufacturing sites. Optimized dosing and reuse often cut chemical spend by 20–40% ($10,000–$100,000 per year).
Effluent targets plants design against include EPA ELG-style BOD and TSS below 30 mg/L with metals below 1 mg/L where those limits apply, EU IED-style COD below 125 mg/L with nitrogen below 10 mg/L and phosphorus below 1 mg/L, and WHO-oriented microbial guidance below 1 CFU/100 mL for some non-potable uses. Non-compliance fines have reached $50,000 per day in cited U.S. chemical cases; one Texas plant avoided $2.4 million in fines after upgrading treatment to meet ELGs.
An Arizona semiconductor fab kept production in a 2022 drought by reusing 95% of wastewater. A California food plant cut energy costs by $80,000 per year by reusing treated water for cooling. Payback is often 3–5 years in food and beverage, 4–6 years in textiles, and 5–7 years in chemicals, with lifetime returns commonly 3–5 times capital when water is scarce. For line-item cost ranges, see our 2025 price guide.
Selection checklist before you buy hardware.
- Meter every major intake, process, and discharge stream for 30–90 days.
- Write reuse quality setpoints (TSS, hardness, TDS, microbes) before selecting membranes.
- Decide brine and sludge outlets; disposal cost often dominates RO economics.
- Size DAF or clarification for peak FOG/TSS, not average day.
- Budget membrane cleaning chemicals and CIP downtime every 3–6 months for MBR.
- Confirm local reuse and discharge permits before locking recovery rate.
- Model payback at your real water and sewer tariffs, not national averages.
Who this is for / Who should look elsewhere / Next step
This page is for plant engineers, EPC teams, and procurement managers sizing reuse or closed-loop trains for manufacturing, food, textiles, chemicals, or metals. Look elsewhere if you need municipal drinking-water plant design, or a full PFAS landfill-leachate BAT study—that is a different feed and regulatory path. If you already know flow (m³/h), feed COD/TDS, and the reuse duty, share those figures on our request-quote form so we can sketch a DAF–MBR–RO block flow against your setpoints.
Frequently Asked Questions
How can industries reduce their water footprint without stopping production?
Industries cut water footprints by reducing intake first, then reusing treated wastewater for non-potable duties, recycling in closed loops, and recovering energy or materials when concentrations allow. Process optimization and leak repair often free 10–30% of intake before new membranes are bought. MBR and RO enable high reuse rates once solids and organics are controlled. Combined, these steps commonly cut industrial water use by 30–70% by sector without cutting production volume.
What technologies are most effective for industrial water reuse?
The most effective reuse stack is usually DAF or clarification for FOG and TSS, MBR for BOD below 5 mg/L, RO when TDS must fall below about 10 mg/L, and ClO₂ or UV for residual microbes. MBR recovery often sits at 90–95% of the biological stage flow. RO recovery of 75–95% depends on feed salinity and energy recovery devices. More membrane selection detail is in our article on membrane technology for water reuse.
What payback should a manufacturing plant expect from reuse?
Most manufacturing reuse projects pay back in 2–7 years, with food and beverage often at 3–5 years and textiles at 4–6 years when water and discharge fees are material. A 100 m³/h plant can save $50,000–$500,000 per year on freshwater at $1–$5 per m³ if intake drops 80–95%. Operating cost typically lands between $0.50 and $2.00 per m³ treated. Lifetime returns of 3–5 times capital appear when drought risk and sewer fees stay high.
How do regulations shape industrial water reuse projects?
Regulations set discharge limits and, in some regions, minimum reuse rates that force treatment upgrades. EPA Effluent Limitation Guidelines can limit BOD, TSS, and metals, with fines cited up to $50,000 per day for non-compliance. EU Industrial Emissions Directive practice and China water rules push 30–50% reuse in selected industries and set COD, nitrogen, and phosphorus caps. Disinfection with ClO₂ generators for water disinfection helps meet microbial reuse criteria when residual and CT are controlled.
Related Equipment
The following HydropureWater products address the wastewater challenges discussed:
- Integrated purification for industrial process water — view specifications, capacity range, and technical data
Need a customized solution? Request a free quote with your specific flow rate and pollutant parameters.