
Why El Segundo Chemical Plants Are Rethinking Activated Sludge in 2026
Three converging pressures are pushing El Segundo chemical-plant EHS managers to revisit activated-sludge designs that were considered settled in the early 2010s. First, the Los Angeles Regional Water Quality Control Board (LARWQCB) has tightened industrial pretreatment limits in successive permit cycles through 2025, with PFAS monitoring triggers now appearing in NPDES renewals across the LA Basin. Second, the Los Angeles County Sanitation Districts (LACSD) industrial waste acceptance criteria for the Joint Water Pollution Control Plant have moved TDS loading caps downward for chloride-bearing discharges, and the September 2024 permit revision added new surcharge triggers at 5,000 mg/L chloride. Third, solvent variability in chlor-alkali, aerospace coating, and specialty-formulation streams has produced enough clarifier washouts in the past 24 months that several plant engineers are re-evaluating whether a 2,000–5,000 mg/L MLSS CAS basin is the right envelope at all.
Generic 2026 MBR-vs-CAS comparisons are not enough for this corridor. The influent is not municipal, the discharge is not to a surface-water-only outfall, and the receiving system is either LACSD's industrial outfall (with explicit surcharge triggers) or the West Basin recycling system that feeds cooling-tower make-up across the South Bay. The next three sections build a chemicals-specific, El Segundo-anchored comparison: influent characterization, process trains, operating envelope, and a regional cost band sized for an actual 2026 capital project memo.
Chemicals Wastewater Influent: What Actually Hits the Biological Stage
El Segundo chemical-plant influent does not match a municipal template, and that is the entire reason the MBR-vs-CAS verdict is not generic. Typical bands for the corridor, drawn from specialty-chemical and chlor-alkali operations discharging to LACSD, are COD 1,000–15,000 mg/L, BOD₅/COD 0.3–0.6, TDS 2,000–15,000 mg/L, chlorides up to 8,000 mg/L, and intermittent solvent slugs to 500 mg/L (toluene, MEK, methylene chloride). PFAS loadings are increasingly characterized in permit renewals, typically in the low ng/L to single-digit µg/L range, with PFOA and PFOS as the targeted species. pH swings of 4–11 during batch discharges are common, and equalization is non-negotiable regardless of which biological process is selected downstream.
These numbers are what flip the verdict between MBR and CAS. A clarifier-based CAS system runs at 2,000–5,000 mg/L MLSS and SRT 5–20 days; a solvent slug of 200–500 mg/L over six hours can wash out the biomass, destroy settling, and force a multi-day recovery. An MBR runs at 8,000–12,000 mg/L MLSS and SRT 30–60 days, and the submerged PVDF membrane physically retains biomass even if toxicity events transiently suppress metabolic activity. The closest peer-reviewed benchmark for this comparison is a textile wastewater pilot that ran 244 days at matched F/M and SRT, reporting COD reduction of 89–92% for MBR versus 54–70% for activated sludge (per the comparative MBR vs AS textile study, 2024). Textile is not chemicals, but it is the only published head-to-head pilot with disclosed operating data, and the directional finding — that MBR outperforms CAS on COD removal and stability at long SRT — is the relevant signal.
The parameter that breaks the analogy is TDS. Textile streams typically run <3,000 mg/L TDS; chemicals streams in El Segundo can run 8,000–15,000 mg/L. At those concentrations, membrane scaling risk changes the OPEX calculus. Section 6 returns to that threshold.
Process Trains Side by Side: MBR and CAS for Chemical Service
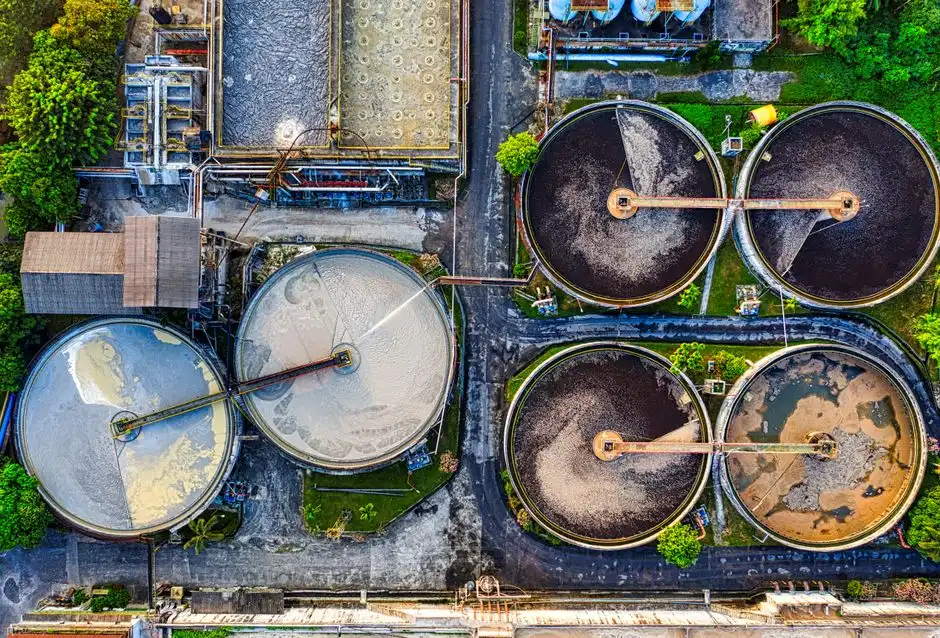
Walking the trains as drawn on a P&ID clarifies where the two systems diverge. The CAS train for chemical service is: influent lift → equalization (24–48 h, with mechanical mixing and pH trim) → primary clarification (FRP or rubber-lined) → aeration basin (2,000–5,000 mg/L MLSS, fine-bubble diffusers) → secondary clarifier (the single point of failure) → RAS/WAS split → tertiary polish (typically cloth-media disc filters or DAF to meet reuse or <10 mg/L TSS limits). Solvent slugs, FOG, and chlorinated compounds all reach the clarifier essentially untreated, and the clarifier is where the system either performs or fails.
The MBR train replaces the clarifier and most of the tertiary step. It runs: influent lift → equalization → fine screening through a rotary mechanical bar screen in the GX series to protect downstream membranes from fibers and rags → anoxic zone (denitrification) → aerobic zone → submerged PVDF cassette membranes in the DF series at 0.1 µm pore size, with permeate drawn under vacuum → permeate tank → optional RO for reuse. Because the membrane is a defined pore size rather than a gravity-settling step, the MBR train decouples HRT from SRT and tolerates the solvent and chloride variability that collapses a clarifier.
Where each train is vulnerable differs. CAS clarifier failure modes are well-known: bulking sludge (SVI >150 mL/g), rising sludge from denitrification in the clarifier, and hydraulic overload. MBR failure modes are fouling from FOG and fibers (mitigated by upstream screening and regular CIP), scaling at high TDS and chloride (mitigated by operating flux and chemistry control), and higher energy draw. The next section quantifies the operating-envelope differences these vulnerabilities produce.
Operating Envelope: MLSS, SRT, HRT, Effluent, and Footprint
The operating envelope for chemical service is not a municipal default, and the table below is sized for the actual bands an El Segundo engineer will see in a design basis memo. The key shifts versus municipal numbers are MBR MLSS toward the upper 8,000–12,000 mg/L range to handle shock loads, and CAS SRT held to 10–20 days to prevent clarifier bulking on variable FOG.
| Parameter | CAS (chemical service) | MBR (chemical service) |
|---|---|---|
| MLSS (mg/L) | 2,000–5,000 | 8,000–12,000 |
| SRT (days) | 5–20 | 30–60 |
| HRT (hours) | 6–24 | 4–12 |
| F/M ratio (d⁻¹) | 0.2–0.5 | 0.05–0.15 |
| Effluent TSS (mg/L) | 10–30 (clarifier only) | <5 |
| Effluent BOD (mg/L) | 10–25 | <5 |
| Effluent turbidity (NTU) | 5–15 | <1 |
| SDI to RO | 3–6 (needs tertiary) | Typically <3 |
| Footprint (relative) | 1.0× baseline | 0.4–0.6× baseline |
The long-SRT stability of MBR is documented at industrial scale. The 2009 Banu et al. A2O-MBR study operated at a designed flux of 77 LMH for 270 days across two MLSS ranges, confirming that high-MLSS MBR operation is stable over multi-month runs typical of chemical-plant service (per Banu et al., 2009). The same stability profile is what makes MBR the default for chemical plants with intermittent solvent discharge.
Two numbers matter most for downstream reuse. MBR permeate TSS is consistently <5 mg/L and turbidity <1 NTU, which puts the SDI typically below 3 — the threshold below which RO membranes can be fed without multimedia filtration. For El Segundo plants with a cooling-tower make-up or process-rinse reuse obligation, this SDI is what eliminates a separate filtration CAPEX line that CAS would otherwise require.
El Segundo Cost Basis: 2026 CAPEX, OPEX, and Payback
The 2026 generic CAPEX and OPEX bands need a regional adjustment before they go into a procurement memo. SoCal Edison's industrial tariffs (TOU-8 and B-19) and LA Basin labor rates push OPEX upward by 8–12% relative to the national average, and the chlor-alkali and specialty-chemical influent bands drive biological-stage sizing toward the upper end of the range.
| Cost line (2026, turnkey) | CAS | MBR |
|---|---|---|
| CAPEX (per m³/day) | $80–$220 | $180–$420 |
| OPEX (per m³, generic) | $0.10–$0.22 | $0.18–$0.42 |
| OPEX, LA Basin adjusted (+8–12%) | $0.11–$0.25 | $0.20–$0.47 |
| Membrane scouring air share of MBR energy | — | 30–50% |
| Membrane replacement ($/m³, amortized) | — | $0.02–$0.05 (5–8 yr life) |
| CIP chemicals (NaOCl 300–500 mg/L + citric) | — | Every 1–4 weeks |
| WAS volume offset vs CAS | Baseline | 20–40% lower |
Membrane scouring air is the single largest variable line, running 30–50% of total MBR energy and decoupling MBR power draw from influent BOD. For El Segundo sites with rooftop solar or behind-the-meter generation, this is a manageable variable; for plants buying power at full TOU-8 rates, it is the line item to scrutinize in vendor proposals. Payback for upgrading CAS to MBR is typically 3–6 years when any of three conditions hold: a reuse obligation exists, the site is land-constrained (<1 acre available for the biological train), or the discharge consent requires <10 mg/L TSS and the CAS baseline needs cloth-media disc filters to meet it. If none of those apply, CAS remains the lower-cost compliant option even at LA Basin OPEX.
When CAS Still Wins: TDS, Chlorides, and Brine Streams
There is a real threshold above which MBR loses the lifecycle-cost argument, and naming it builds credibility. When biological-stage influent TDS exceeds 8,000 mg/L or chloride exceeds 5,000 mg/L, membrane scaling risk rises sharply: CIP frequency moves from monthly toward weekly, antiscalant dosing increases, and the OPEX gap between MBR and CAS narrows or reverses. At influent TDS >10,000 mg/L, the right answer is usually CAS followed by a sidestream RO/ZLD configuration, or a hybrid CAS + MBR polish where the MBR handles only the polished stream.
MBR does retain a 20–40% lower WAS volume than CAS at matched SRT, consistent with the "less sludge production due to much longer sludge age" finding from Banu et al. (2009). That is a real savings on sludge hauling and disposal, which is meaningful for an El Segundo generator paying California tipping fees, but it is not enough to flip the verdict at high TDS. For plants above the 8,000 mg/L TDS threshold, the ZLD vs high-recovery RO brine management guide is the right next read, since the biological-stage choice is downstream of the brine-management decision rather than upstream of it.
For retrofit sites where the existing aeration basin is reusable and the clarifier is the bottleneck, the hybrid CAS + MBR polish is often the lowest-CAPEX path: keep the CAS basin, decommission the clarifier, install submerged membrane cassettes downstream, and reuse the existing RAS/WAS infrastructure.
Selection Framework for the El Segundo Chemical Plant
Defaulting to MBR or CAS is a site-specific call, not a brand preference. The matrix below is the version a process engineer can apply to a real El Segundo influent and footprint in a single meeting.
| Site condition | Default selection |
|---|---|
| Solvent variability, intermittent slugs >100 mg/L | MBR |
| PFAS polish obligation, ng/L monitoring trigger in permit | MBR |
| Reuse or cooling-tower make-up duty | MBR |
| <1 acre available footprint, urban infill | MBR |
| Discharge consent <10 mg/L TSS without tertiary filters | MBR |
| Influent TDS >8,000 mg/L or Cl⁻ >5,000 mg/L | CAS or CAS + RO/ZLD |
| No reuse obligation, >3 acres available | CAS |
| Existing clarifier in serviceable condition, retrofit only | CAS or hybrid CAS + MBR polish |
For greenfield and retrofit projects that fall on the MBR side of the matrix, an integrated MBR membrane bioreactor system sized 10–2,000 m³/day, paired with the DF series PVDF flat sheet membrane modules, covers most chemical-plant envelopes without custom tankage. For sites in the high-TDS band, the next decision is brine management rather than biological-stage selection.
Frequently Asked Questions
Is MBR or CAS the better choice for an El Segundo chemical plant discharging to LACSD?
Default to MBR if the plant has solvent variability, a PFAS monitoring trigger, a reuse obligation, or <1 acre available footprint. Default to CAS if influent TDS exceeds 8,000 mg/L or chloride exceeds 5,000 mg/L, the site has >3 acres, and there is no reuse duty. LACSD surcharge triggers at 5,000 mg/L chloride make TDS the dominant variable, not effluent TSS alone.
What is the 2026 OPEX gap between MBR and CAS in Los Angeles County?
Generic 2026 OPEX is $0.10–0.22/m³ for CAS and $0.18–0.42/m³ for MBR. Adjusted for SoCal Edison industrial tariffs and LA Basin labor, the bands move to $0.11–0.25/m³ and $0.20–0.47/m³ respectively. Membrane scouring air at 30–50% of MBR energy is the largest single variable line, not influent BOD load.
At what TDS or chloride level does MBR stop being cost-effective?
Above 8,000 mg/L TDS or 5,000 mg/L chloride in the biological influent, CIP frequency rises and the MBR OPEX advantage erodes. Above 10,000 mg/L TDS, CAS followed by sidestream RO/ZLD is typically lower lifecycle cost than MBR. The 20–40% lower WAS volume of MBR is a real offset but does not flip the verdict at high TDS.
Can MBR permeate feed RO without multimedia filtration?
Yes. MBR permeate typically runs TSS <5 mg/L, turbidity <1 NTU, and SDI <3, which is the threshold below which RO membranes can be fed directly. CAS effluent typically needs cloth-media disc filters or DAF to reach the same SDI, which is a hidden CAPEX line that should be priced into any CAS baseline before declaring MBR more expensive.
Can an existing CAS plant be retrofitted to MBR?
Yes, in most cases the aeration basin is reusable as the MBR aerobic zone, with submerged membrane cassettes added and the secondary clarifier decommissioned. RAS piping, scum removal, and mixed-liquor distribution must be redesigned. Payback is typically 3–6 years when a reuse obligation, land constraint, or <10 mg/L TSS consent applies. Field troubleshooting patterns are documented in the MBR troubleshooting playbook.
Related Equipment
- DF series PVDF flat sheet membrane modules — specifications, capacity range, and technical data