Why Vitamin Manufacturing Wastewater Needs Advanced Oxidation
Vitamin C (ascorbic acid) and B-complex production generates fermentation residues with COD commonly 5,000–25,000 mg/L and intense yellow-brown color from residual pyridoxine, riboflavin, and nicotinamide chromophores that conventional activated sludge cannot break down. Raw vitamin mother liquor characterized in peer-reviewed work showed pH 6.98, COD 63,000 mg/L, BOD 7,717 mg/L, and a BOD/COD ratio of just 0.12 — a value that signals an effluent the biomass will barely touch (S3, MDPI Processes 2025-08). After ozone pretreatment at 7 g/h and 4% w/w O₃ for 4 hours, that same stream's BOD/COD rose to 0.44, COD dropped 41%, and color fell 33.3%; ten subsequent days of aerobic biodegradation then pushed cumulative COD reduction to 73% (S3). The implication for a vitamin plant EHS manager is direct: the goal of advanced oxidation is to convert bio-recalcitrant molecules into biodegradable fragments, not to destroy high-strength loadings on its own.
Conventional biotreatment typically leaves a BOD/COD below 0.2 in vitamin fermentation effluent, which is the threshold that triggers non-compliance in 2026 discharge permits (China GB 21904 chemical synthesis effluent standard, EU 2022/647 watch list compounds). Vitamin A synthesis adds its own recalcitrance through residual β-carotene and conjugated polyene isomers that absorb strongly in the visible range. An ozone oxidation system positioned after a well-functioning biological stage addresses both the color and the biodegradability deficit in a single unit operation — but only if it is sized to the right dose window and the right position in the train.
Ozone Chemistry: Molecular O₃ versus the Hydroxyl Radical Pathway
Molecular ozone has a standard reduction potential of 2.07 V and reacts selectively with electron-rich functional groups — double bonds, aromatic amines, phenols — which are exactly the moieties left behind by fermentation residues and B-vitamin chromophores. At pH above 8.5, ozone decomposes through a chain reaction that generates hydroxyl radicals (•OH) with E° = 2.85 V, which then attack saturated and otherwise unreactive organics non-selectively. This is why alkaline conditions benefit vitamin effluents: they arrive near pH 7 but can be lifted with NaOH or lime, shifting the dominant pathway from selective O₃ to radical-driven AOP without changing the reactor hardware.
Refinery data from the Shiraz oil study demonstrated the magnitude of the radical effect: 92% COD and 100% sulfide removal at pH 9.4 with O₃/UV at a 2,335 mg/L dose (S3, 2025-08). Vitamin streams carrying sulfide or sulfite reducing agents from upstream unit operations inherit the same alkalinity-driven advantage. The O₃/H₂O₂ mode (Peroxone) converts nearly 100% of input O₃ to •OH at an optimal O₃:H₂O₂ mass ratio near 1:0.7; textile permeate trials confirmed >90% color removal at about 150 mg/L utilized dose (S3, 2025-08). For a vitamin plant spec sheet, the working definition of an ozone oxidation system is unambiguous: an ozone generator fed with oxygen or air, a diffuser or venturi contactor, an off-gas thermal or catalytic destructor, and a control panel — sized in g O₃/h per m³ of wastewater flow.
Vitamin Effluent Characterization and Design Basis Parameters
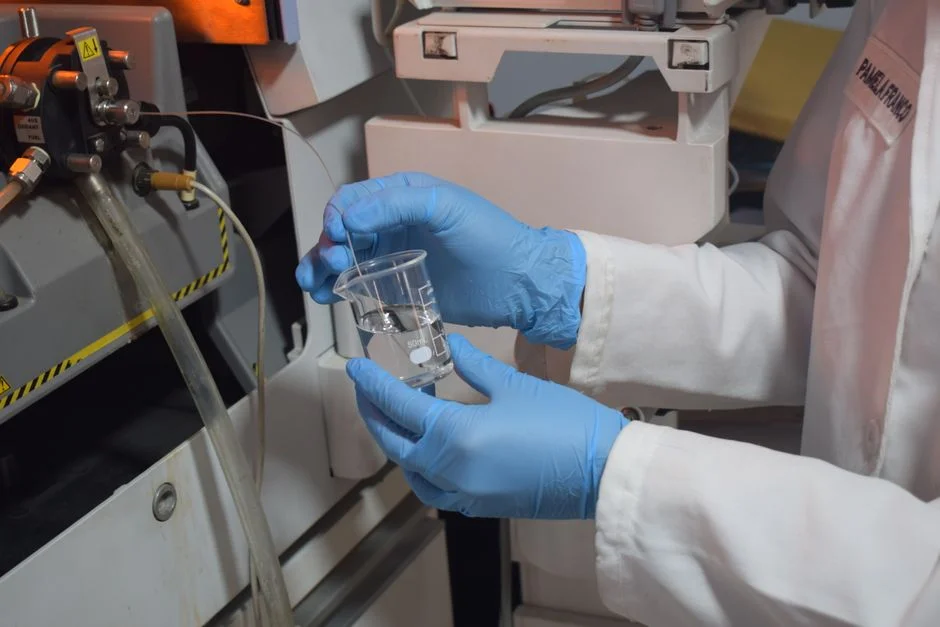
Before an OEM can quote a generator, the engineer must produce a characterization table with the parameters that drive sizing. The typical vitamin manufacturing wastewater envelope is COD 3,000–25,000 mg/L, BOD₅ 1,500–7,000 mg/L, TSS 500–4,000 mg/L, pH 4–9, color 1,000–5,000 Pt-Co units, and temperature 25–40°C. Mother liquor from ascorbic acid synthesis can spike above 60,000 mg/L COD, but the slipstream sent to ozone polishing is normally the post-MBR effluent, which is where the polishing-stage numbers apply.
Pilot and bench data points from analogous food and fermentation studies translate directly into design ranges. A food-industry analogue (tofu plant) effluent post-biotreatment carried COD 520 mg/L, TOC 215 mg/L, and BOD₅ 151 mg/L; an applied ozone dose of 39 mg/L removed 54 mg/L COD in one hour (S3, 2025-08). A second textile/food bench study with applied doses of 405–1,620 mg/L over 0.5–2 h cut color from 3,010 to 200 units, turbidity from 130 to 15 NTU, COD from 1,100 to 101 mg/L, and BOD₅ from 305 to 59 mg/L in a single operation (S3, 2025-08). The non-linear dose response is critical: at ozone doses of 100, 200, and 300 mg/L for 2 hours, COD removal was 43%, 65%, and 44% respectively — proof that pushing dose higher past the optimum wastes energy and can re-form recalcitrant by-products. The safe design window for non-pressurized contactors is an applied ozone injection rate of 0.09–0.15 g O₃/L·h (1.5–2.5 mg/L·min); above 0.2 g/L·h the marginal COD gain flattens (S3).
| Parameter | Vitamin Effluent (pre-ozone, post-MBR) | Typical Range to Engineer Against |
|---|---|---|
| COD | mg/L | 300–2,500 |
| BOD₅ | mg/L | 60–500 |
| BOD/COD | ratio | 0.10–0.20 (target post-O₃: >0.30) |
| Color | Pt-Co | 500–3,000 (target post-O₃: <200) |
| TSS | mg/L | <50 (MBR permeate) |
| pH | — | 6.5–8.0 (raise to 8.5–9.0 for •OH pathway) |
| Temperature | °C | 25–35 |
| Applied O₃ dose | mg/L | 100–500 (pilot-locate optimum) |
| Contactor HRT | min | 30–120 |
Where Ozone Fits in the Treatment Train: MBR + Ozone vs. Ozone Alone vs. Conventional Bio
A 400 L pilot with venturi injection at up to 600 mg O₃/L produced a ranking that is directly useful for vitamin plant topology: post-biological treatment gave 81% COD removal, process water 60%, pre-biological 46%, and bleaching water only 28% (S3, 2025-08). The decisive variable is position — placing ozone after an aerobic or MBR stage captures the highest return because the bulk COD is already mineralized and ozone only has to handle the recalcitrant fraction. A practical train for a vitamin plant reads: equalization → DAF or lamella for TSS and oils → anaerobic or aerobic MBBR → MBR polishing → ozone contactor → optional activated carbon for residual ozone by-products. DAF upstream is especially useful for the high-TSS mother liquor slipstream that carries cell debris and oil.
For low-strength finishing effluent a pharmaceutical benchmark is informative: ozone alone at 10 mg/L plus H₂O₂ at 1.8 mL/L at pH 6 for 60 min achieved 46.3% COD removal (S3, 2025-08) — a defensible spec for vitamin tablet-coating wastewater. For high-strength mother liquor, route a slipstream through ozone to oxidize inhibitory compounds before it is recycled to the bioreactor, rather than ozonizing the full flow; the side benefit is that ozonation raised specific oxygen uptake rate (SOUR) by 126.2% on textile effluent (S3, 2025-08), direct evidence that the biotreatment downstream will be more active on a pre-ozonated feed.
Comparing Ozone Modes: O₃ Alone, O₃/H₂O₂, and O₃/UV for Vitamin Effluent

The three ozone operating modes split along three axes: oxidation power, CAPEX, and OPEX. O₃ alone has the lowest capital cost and is best for color and aromatic chromophore removal; the risk is bromate formation if the wastewater carries more than 0.1 mg/L bromide, which is a real consideration in coastal Chinese vitamin plants. O₃/H₂O₂ (Peroxone) converts most of the input O₃ to •OH and pushes the BOD/COD ratio upward more aggressively; 60–80% COD removal is achievable on food-pharma streams at 200–500 mg/L applied dose, with the 1:0.7 mass ratio as the design target (S3, 2025-08). O₃/UV delivers the highest oxidation power — 92% COD on the Shiraz refinery case at 2,335 mg/L, pH 9.4, 15°C, and 56% COD with 71% color reduction at 0.2 mg/mL ozone for 3 h on a textile stream (S3, 2025-08) — but UV lamp fouling and energy cost are the OPEX constraints that often push the mode out of contention for color-saturated vitamin streams.
For vitamin manufacturing the default specification is O₃/H₂O₂ unless the stream is sulfide-bearing (in which case the alkaline O₃/UV case is supported by refinery data) or the target chromophore is highly conjugated, as with residual β-carotene from vitamin A synthesis, where UV photolysis adds genuine incremental removal. A design memo should state the mode, the applied dose, the O₃:H₂O₂ ratio, the contactor pH, and the anticipated bromate risk before any pilot runs.
| Mode | Best For | Typical Dose (mg/L) | Expected COD Removal | Key Limitation |
|---|---|---|---|---|
| O₃ alone | Color, aromatic chromophores | 100–300 | 40–65% | Bromate risk if Br⁻ > 0.1 mg/L |
| O₃/H₂O₂ (Peroxone) | BOD/COD lift, mixed recalcitrance | 200–500 at 1:0.7 mass ratio | 60–80% | H₂O₂ storage and cost |
| O₃/UV | Sulfide, conjugated color bodies (VA) | 200–2,000+ | 70–92% | Lamp fouling, energy OPEX |
Pilot Testing Protocol for a Full-Scale Vitamin Plant Ozone System
A defensible pilot sequence for a vitamin plant starts with a 1.5–2.5 L semi-batch borosilicate reactor with diffuser-fed ozone, bracketing the dose-response curve at three applied doses (e.g., 16, 28, 39 mg/L) and three contact times (S3, 2025-08). Real vitamin effluent should be used, not synthetic; matrix effects from residual fermentation salts, yeast extract, and antifoam agents can shift the optimum by 50% relative to the bench. Sampling at t = 0, 15, 30, 60, 120, and 240 minutes should include COD, BOD₅, TOC, color (Pt-Co), UV₂₅₄, pH, residual dissolved O₃, and bromide/bromate where relevant. UV₂₅₄ is the cheap surrogate for aromaticity and is the variable to trend when scaling up.
The single most important output of the pilot is the BOD/COD inflection: the applied dose that pushes the post-ozone BOD/COD above 0.3 is typically the operating setpoint for combined ozone + downstream bio operation, and is the number the design basis memo should quote. From the pilot ct product (ozone residual × contact time), the full-scale contactor HRT is set at 1.5–2× the pilot value to cover the scale-up safety factor. Off-gas O₃ must be measured and a thermal or catalytic destruct unit sized at 110–120% of generator output, which is the compliance expectation in 2026 under EU industrial emissions rules and PRC GB discharge norms.
Operating Cost Drivers and 2026 Compliance Targets
OPEX for an ozone oxidation system is dominated by power (about 8–12 kWh per kg O₃ generated, depending on feed gas), liquid oxygen supply if specified, H₂O₂ dose for Peroxone mode, and off-gas destruction energy. The two largest levers an engineer can pull are (1) raising feed-gas oxygen concentration from air to 90%+ O₂, which raises generator output 2–3× and cuts specific energy, and (2) installing a heat-recovery loop on the off-gas destructor to pre-warm feed gas. Turnkey skid integration with the upstream MBR allows shared blowers, controls, and an integrated SCADA tag set, which lowers both installed cost and operator burden during commissioning.
Compliance targets in 2026 are tightening on both endpoints. China GB 21904 sets COD ≤ 50 mg/L and color ≤ 30 dilution units for the chemical synthesis sector, and the EU 2022/647 watch list flags several vitamin-relevant recalcitrant compounds. Ozone polishing must be paired with a downstream safeguard — typically a granular activated carbon or UV/H₂O₂ polishing step — to take out residual ozone, bromate, and any aldehyde by-products that the AOP can leave behind. For a deeper read on the disinfection-side economics, the ozone-vs-UV 2026 engineering buyer-side guide is a useful counterweight to the COD-removal framing in this article.
| Cost / Compliance Lever | 2026 Typical Range or Limit | Engineering Lever |
|---|---|---|
| Specific energy | 8–12 kWh/kg O₃ | Switch feed gas from air to LOX |
| H₂O₂ consumption (Peroxone) | 0.5–0.7 kg H₂O₂ per kg O₃ | Trim to 1:0.7 mass ratio optimum |
| Off-gas destruction sizing | 110–120% of generator output | Add thermal destruct unit |
| China GB 21904 COD | ≤ 50 mg/L at discharge | MBR + ozone + carbon polish |
| China GB 21904 color | ≤ 30 dilution units | Peroxone or O₃/UV |
| Bromate (WHO/EU drinking water guideline as proxy) | ≤ 10 µg/L | Monitor feed Br⁻, switch to AOP if >0.1 mg/L |
Frequently Asked Questions
What applied ozone dose should a vitamin plant expect to dose for post-MBR polishing?
Most vitamin post-MBR polishing duty lands in the 200–500 mg/L applied ozone range, with the precise optimum located by pilot at 1.5–2.5 mg/L·min injection rate (S3, 2025-08). Above 500 mg/L the marginal COD gain flattens and energy cost rises non-linearly.
Should ozone go before or after biological treatment in a vitamin effluent train?
After. A 400 L pilot ranked post-biological application at 81% COD removal, against only 46% when ozone was placed before the bio stage (S3, 2025-08). The recommended train is equalization → DAF → MBBR → MBR → ozone contactor → activated carbon.
Is O₃ alone sufficient, or should a vitamin plant specify O₃/H₂O₂?
For most vitamin finishing effluent, O₃/H₂O₂ at a 1:0.7 mass ratio is the better default because it drives the BOD/COD ratio above 0.3 and achieves 60–80% COD removal at 200–500 mg/L. O₃ alone is acceptable when the stream is low in bromide and color is the primary target; O₃/UV is reserved for sulfide-bearing or highly conjugated chromophores such as residual β-carotene from vitamin A synthesis.