How Much Water Will Green Hydrogen Need in 2026?
Global water demand for green hydrogen in 2026 is projected at 1,650–3,300 million tonnes per year, driven by 90–180 Mt of electrolyzer H₂ output (derived from the IRENA and IEA 2025 baseline of 90–180 Mt H₂ × 9–18 m³/t including system losses). Each tonne of green hydrogen requires 9–11 m³ of deionized water — meaning a 100 MW electrolyzer consumes roughly 5,200 m³/day of high-purity feed water meeting ASTM D5127 Type I/II specifications (resistivity >1 MΩ·cm, TOC <50 ppb).
The stoichiometric floor is fixed by chemistry: the molar mass ratio of H₂O (18 g/mol) to H₂ (2 g/mol) gives a theoretical minimum of 9 kg water per 1 kg H₂. In practice, every commercial electrolyzer stack adds 10–20% losses for cooling-tower evaporation, polishing-loop bleed, membrane CIP, and RO blowdown. The delivered feed water requirement therefore lands at 9–11 m³ per tonne of H₂ produced, depending on stack efficiency, ambient temperature, and whether the site uses air cooling or water cooling.
Regional scaling is steep. The EU's REPowerEU plan targets 28–42 Mt of domestic renewable H₂ by 2030, implying 250–460 Mt of annual water demand even before imports. The US DOE Hydrogen Shot pathway adds another 180–250 Mt of water demand by 2030 as gigawatt-scale projects come online. NEXT Hydrogen has publicly noted that declining renewable LCOE is driving 2026 electrolyzer deployment into the multi-gigawatt tier, which multiplies the water footprint proportionally — and concentrates the load on a handful of arid and semi-arid project sites. The implications for raw water intake permitting and brine disposal are already shaping the 2026 water treatment market outlook.
Water Quality Specifications Electrolyzers Actually Require
PEM electrolyzers require ASTM D5127 Type I water with resistivity >1 MΩ·cm and TOC below 50 ppb; alkaline electrolyzers can accept Type II (>0.1 MΩ·cm) but still demand hardness below 0.1 ppm as CaCO₃ to prevent diaphragm scaling.
The table below summarizes the parameters a treatment system must hit to keep the electrolyzer OEM warranty intact. Most stack vendors — including Nel, Cummins, and Plug Power — reference ASTM D5127 directly in their feed water interface documents, so specifying to this standard is the cleanest way to defend the warranty clause during procurement.
| Parameter | ASTM D5127 Type I (PEM) | ASTM D5127 Type II (Alkaline) | Failure Mode if Exceeded |
|---|---|---|---|
| Resistivity (25 °C) | > 1 MΩ·cm (target > 10 MΩ·cm at EDI outlet) | > 0.1 MΩ·cm | Stack current leakage, efficiency loss |
| TOC | < 50 ppb | < 200 ppb | Organic fouling of membrane/diaphragm |
| Silica (SiO₂) | < 10 ppb | < 10 ppb | 15–25% efficiency loss from scaling in alkaline stacks |
| Hardness (as CaCO₃) | < 0.1 ppm | < 0.1 ppm | Diaphragm blinding, flow restriction |
| Free chlorine | < 0.1 ppm | < 0.5 ppm | Membrane degradation, catalyst poisoning |
| Feed temperature | 15–35 °C | 15–80 °C | Thermal stress on seals, gas crossover |
Consequences of non-conformance are not theoretical. Chloride ingress into a PEM membrane-electrode assembly cuts stack lifetime by 30–60%, according to published PEM degradation studies cited in DOE hydrogen program records. Silica carryover into an alkaline cell scales the diaphragm and pulls operating voltage up by 50–150 mV per cell, translating to a 15–25% efficiency loss within the first 6–12 months. Mettler-Toledo's conductivity-sensor monitoring approach — placing inline sensors at the RO permeate, EDI outlet, and electrolyzer feed loop — is now the de-facto verification method, because grab-sample laboratory analysis is too slow to catch a contamination excursion before the stack sees the bad water.
The Treatment Train: From Raw Intake to Electrolyzer-Grade Water
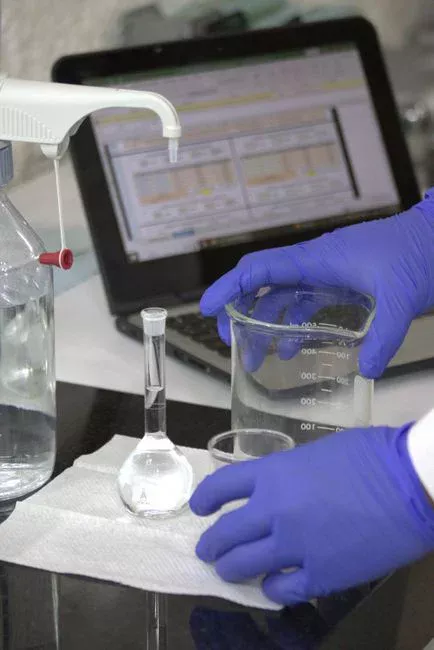
A four-stage train of multimedia filtration, double-pass RO, EDI, and a polishing mixed-bed delivers ASTM D5127 Type I water at 90–95% overall recovery — and is the architecture most electrolyzer OEMs will sign off on.
Stage 1 — Pretreatment. Multimedia filtration (sand + anthracite + garnet) plus activated carbon drops total suspended solids below 1 mg/L and strips free chlorine to under 0.1 ppm. This step is non-negotiable: chlorine damages thin-film composite RO membranes within hours, and turbidity spikes foul the RO feed channels. For surface-water sources, a DAF pretreatment system or a lamella clarifier upstream of the multimedia filter handles the algae and colloidal load that raw river or reservoir water typically carries in spring and summer.
Stage 2 — Double-pass RO. A two-pass RO array achieves 99.5% salt rejection and brings TDS under 10 mg/L, at a recovery rate of 75–85%. The inter-stage pump and blend valve between pass 1 and pass 2 are critical for hitting the silica spec; single-pass RO leaves 100–500 ppb SiO₂ in the permeate, which overwhelms the downstream EDI.
Stage 3 — Electrodeionization (EDI). EDI polishes the RO permeate to >10 MΩ·cm resistivity and <10 ppb silica without chemical regeneration. It uses a continuous DC field to drive ions out through selective membranes while the resin bed is regenerated in situ. For green hydrogen duty, EDI has displaced mixed-bed ion exchange in nearly every PEM project above 5 MW because it eliminates acid and caustic regen chemicals and the associated wastewater load. A packaged industrial RO water treatment system sized for a 100 MW electrolyzer typically integrates stages 1–3 on a single skid.
Stage 4 — Polishing guard. A final mixed-bed polisher or 0.1 µm sub-micron filter sits immediately upstream of the electrolyzer feed loop as a guard against any resin fines, microbubbles, or EDI breakthrough events. Conductivity sensors at each stage boundary — feed, RO permeate, EDI outlet, polishing outlet — provide the real-time purity verification the OEM warranty letter requires.
Sizing the Water System for a 10–100 MW Electrolyzer
A 100 MW PEM electrolyzer operating at 60% capacity factor produces roughly 1,800 tonnes H₂/year and requires 16,200–19,800 m³ of deionized water annually — about 52 m³/hr continuous, or 5,200 m³/day at full load. Add 20% for blowdown recycle and the raw water intake target is 6,240 m³/day.
The table below scales this to the project sizes a developer or EPC procurement lead typically evaluates. The numbers assume PEM duty at the 9–11 m³/t H₂ consumption rate; alkaline systems run 8–10% higher in absolute water use because of higher operating temperatures and more blowdown from the KOH loop.
| Electrolyzer Size | Annual H₂ Output (60% CF) | Deionized Water Demand | Daily Treated Water (Full Load) | Raw Water Intake (incl. 20% blowdown) |
|---|---|---|---|---|
| 10 MW | ~180 t/yr | 1,620–1,980 m³/yr | ~520 m³/day | ~625 m³/day |
| 25 MW | ~450 t/yr | 4,050–4,950 m³/yr | ~1,300 m³/day | ~1,560 m³/day |
| 50 MW | ~900 t/yr | 8,100–9,900 m³/yr | ~2,600 m³/day | ~3,120 m³/day |
| 100 MW | ~1,800 t/yr | 16,200–19,800 m³/yr | ~5,200 m³/day | ~6,240 m³/day |
Storage buffer sizing should be 24–48 hours of treated water on-site, both as a safety margin for the RO membrane CIP cycle (which takes the RO skid offline for 4–6 hours) and to provide restart volume for the electrolyzer if the raw water pump trips. For a 100 MW project, that translates to a 5,000–10,000 m³ treated-water storage tank, typically HDPE-lined or AWWA D103 bolted steel. The same project will need a 12,000–15,000 m³ raw water equalization basin to absorb diurnal variation from the intake source.
Comparing Treatment Configurations: RO+EDI vs. RO+IX vs. Two-Pass RO
RO+EDI is the only configuration that meets PEM purity specs without batch chemical regeneration; RO+IX trades lower CAPEX for higher OPEX; two-pass RO alone fails the silica spec for high-pressure stacks.
The table below distills the trade-offs an EPC procurement lead will see in vendor bids. CAPEX figures are 2026 USD per m³ of daily treated water capacity; OPEX is per m³ of treated water actually produced.
| Configuration | CAPEX ($/m³/day) | OPEX ($/m³ treated) | Recovery | Output Resistivity | Best Fit |
|---|---|---|---|---|---|
| RO + EDI | $0.18–$0.42 | $0.18–$0.42 | 90–95% | > 10 MΩ·cm | PEM, all sizes; alkaline above 10 MW |
| RO + Ion Exchange | $0.12–$0.25 | $0.55–$0.90 | 75–85% | 1–5 MΩ·cm | Alkaline, 5–25 MW, low-utilization sites |
| Two-Pass RO only | $0.10–$0.20 | $0.15–$0.30 | 70–80% | 1–2 MΩ·cm | Cost-sensitive alkaline below 10 MW only |
The decision rule that holds up in nearly every bid review: specify RO+EDI for any PEM project, regardless of size, because the alternative configs cannot meet the <10 ppb silica spec without an EDI polish stage anyway. For alkaline projects, RO+EDI is preferred above 10 MW where continuous operation amortizes the higher CAPEX, while RO+IX remains viable at 5–25 MW with low utilization factors where batch regeneration downtime is tolerable. A multi-media pretreatment filter sized to the RO feed flow is required in all three configurations.
Water Reuse and Sourcing Economics in 2026
Closed-loop reuse of RO concentrate and cooling-tower blowdown can cut raw water intake by 30–40%, and in arid regions the avoided brine disposal cost ($2–$8/m³ in UAE, Saudi Arabia, and inland China sites) pays back the high-recovery EDI system within 18–30 months.
The ESG case is now as important as the OPEX case. Per-kg-H₂ water footprint of 9–11 L has become a standard disclosure metric in EU Renewable Energy Directive III reporting and in green hydrogen offtake agreements across Asia-Pacific. Developers who can document a sub-9 L/kg figure — by reusing 30–40% of blowdown for irrigation, scrubber make-up, or concrete mixing — gain a measurable bid advantage in the 2026 EU Hydrogen Bank auction windows. For inland sites where brine disposal is constrained or where aquifer recharge is regulated, tying the electrolyzer water train into a hybrid ZLD (zero liquid discharge) design using an integrated water purification system with a brine concentrator and crystallizer is increasingly standard. The same approach supports climate-resilient water infrastructure planning by reducing the project's exposure to drought-year intake restrictions, which have already delayed FID on at least three announced gigawatt-scale projects in southern Spain and Western Australia.
Frequently Asked Questions
How much water does it take to produce 1 kg of green hydrogen?
9–11 L of deionized water per kg of H₂, combining the 9 kg stoichiometric minimum (H₂O molar mass ratio) with 10–20% system losses for cooling-tower evaporation, polishing-loop bleed, and RO blowdown (per IRENA 2025 electrolyzer water consumption benchmarks).
What purity of water do PEM electrolyzers need?
ASTM D5127 Type I water with resistivity above 1 MΩ·cm (target above 10 MΩ·cm at the EDI outlet), TOC below 50 ppb, silica below 10 ppb, and hardness below 0.1 ppm as CaCO₃, per Nel and Plug Power feed water interface specifications.
Can you use seawater for green hydrogen production?
Yes, via SWRO desalination pretreatment, but this adds $0.30–$0.60/m³ to the treatment cost and the full RO+EDI polishing train is still required post-desalination to hit ASTM D5127 Type I — making seawater economically marginal outside coastal sites with no fresh alternative.
How much does a water treatment system for a 50 MW electrolyzer cost?
USD $2.8–$4.5 million CAPEX for a complete RO+EDI skid sized to 3,120 m³/day raw water intake, with OPEX running $0.18–$0.42/m³ of treated water produced (HydropureWater field data, 2026).