Why Nutrient Recovery Is the Defining Water Market Story of 2026
The nutrient recovery market is projected to reach $8.4B by 2030 at 7.1% CAGR (per HydropureWater's 2030 nutrient recovery forecast), and seven distinct drivers are accelerating demand in 2026: tightening EU and Chinese nutrient removal regulations, volatile phosphate rock import pricing, maturing struvite crystallization and membrane technology, ESG-linked capital flows, municipal water reuse mandates, biogas co-recovery economics, and phosphorus scarcity classified as a critical raw material by the EU CRM list. Each driver creates a different capex trigger, but regulatory tightening and phosphorus scarcity are the two with the shortest decision timelines for industrial buyers.
Within the broader $591B resource recovery from wastewater market, which is expanding at 11% CAGR through 2030 (per the broader resource recovery from wastewater forecast), nutrient recovery is the highest-margin sub-segment because the recovered products — struvite (MgNH4PO4·6H2O), ammonium sulfate, and calcium phosphate — have direct offtake markets in the fertilizer industry. Scope matters: "nutrient recovery" here means recovery of nitrogen (N) as ammonia or ammonium sulfate, phosphorus (P) as struvite or calcium phosphate, and potassium (K) from municipal and industrial wastewater streams — not generic water polishing or desalination reuse.
The signal that 2026 is the inflection year comes from the IWA Nutrient Removal and Recovery conference (NRR2026), held 17-21 May 2026 in Delft. NRR2026 is the flagship venue where regulators, academics, and technology vendors align on the next compliance cycle, and the conference theme — "resilient, sustainable, and climate-proof cities" — confirms that city-level procurement is now the dominant demand vector, not industrial site-level innovation.
The 7 Forces Driving the Nutrient Recovery Market in 2026
Seven primary drivers influence 2026 capex decisions, ranked by weighted impact:
- EU nutrient discharge regulation (UWWTD revision). Binding P-recovery or removal obligations on WWTPs >100,000 PE through 2026-2030 milestones.
- China GB phosphorus and ammonia-nitrogen standards. P limits tightening to <0.5 mg/L in sensitive receiving waters under GB 18918-2002 and industrial discharge rules.
- Phosphate rock scarcity and price volatility. EU CRM Act classification plus a $120-$450/tonne price band over 2021-2025 makes recovered P a supply-chain hedge.
- Technology maturity in struvite, membrane, and biological routes. More than 50 full-scale struvite installations globally remove the "pioneer tax" on capex.
- ESG-linked capital flows and green bond offtake contracts. EU Green Bond Standard (2024) and CSRD disclosure rules improve project IRR.
- Municipal water reuse mandates (EU 2020/741). N and P polishing becomes a precursor to potable and industrial reuse.
- Biogas co-recovery economics and geopolitical fertilizer reshoring. Anaerobic digestion + nutrient recovery stack revenue streams and qualify for domestic-supply incentives.
These drivers dictate the timing and type of equipment procurement for municipal and industrial plants.
Driver 1 — Tightening Nutrient Discharge Regulations in the EU and China
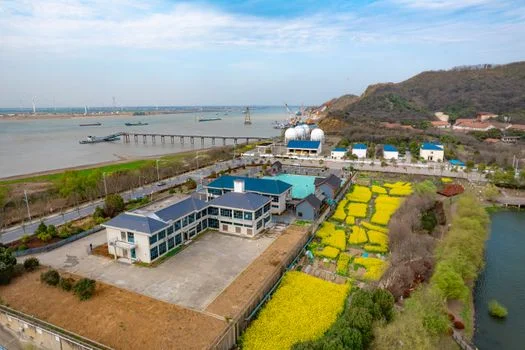
The EU Urban Waste Water Treatment Directive (91/271/EEC) entered its 2024 revision cycle, with tightened nitrogen and phosphorus discharge limits for WWTPs serving more than 100,000 population equivalents and full compliance milestones running from 2026 through 2030. Plants in sensitive catchment areas now face effluent total phosphorus targets of 0.5-1.0 mg/L and total nitrogen below 10 mg/L, depending on receiving-water classification. China's regulatory counterpart, GB 18918-2002 for municipal discharge and GB 30485 for industrial discharge, has tightened P limits to <0.5 mg/L in sensitive receiving waters, with provincial implementation in the Yangtze and Pearl River basins now enforced through discharge permit renewal cycles.
For capex planning: any plant in an EU member state or Chinese province facing 2026-2028 permit renewal needs a defined nutrient removal or recovery path on the books by Q4 2026 to stay on the milestone schedule. Recovery is consistently the more cost-effective compliance path over 10-15 year horizons because the recovered product offsets chemical purchase and creates a fertilizer offtake line — removal alone is a perpetual opex liability. The NRR2026 Delft conference emphasis on "climate-proof cities" is a procurement signal: municipal WWTPs, not industrial sites, are where the 2026 compliance dollars will land first.
Driver 2 — Phosphate Rock Scarcity and Price Volatility
Phosphate rock was classified as a strategic raw material in the EU Critical Raw Materials Act (2024), with more than 80% of EU phosphate supply imported and Morocco plus China controlling roughly 70% of global reserves. Spot phosphate rock prices ranged from $120/tonne to $450/tonne between 2021 and 2025, a volatility band wide enough to break fertilizer procurement budgets for downstream users. For finance and procurement teams, recovered phosphorus is now a supply-chain hedge, not just an ESG line item — the strategic logic is identical to rare-earth recycling or lithium recovery from brines.
On commercial pricing, recovered struvite in 2026 trades at $0.40-$0.80/kg of P content, competitive with mined phosphate on a P-content basis once logistics and import duty are factored in. For a 100,000 PE plant recovering 30-50% of influent P, the annual recovered struvite value lands in the $200,000-$600,000 range, which materially shifts the project IRR for a struvite reactor plus chemical dosing system.
Driver 3 — Technology Maturity: Struvite Crystallization, Membrane, and Biological Routes
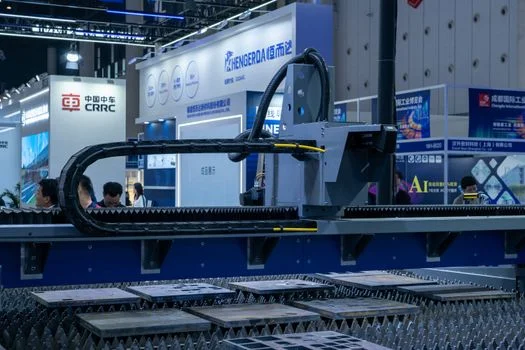
Struvite crystallization (MgNH4PO4·6H2O) reactors are now commercial at more than 50 full-scale installations globally, with documented P-recovery rates above 90% from anaerobic digester centrate. Membrane bioreactor (MBR) systems paired with chemical precipitation achieve effluent total phosphorus below 1 mg/L (per HydropureWater MBR product data), which is sufficient for most EU and Chinese sensitive-catchment permits. For nitrogen recovery, membrane contactors and forward-osmosis ammonia strippers are emerging as the N-side complement to struvite on the P-side, with the first commercial municipal installations commissioned in 2024-2025.
Bio-electrochemical nutrient recovery cells — referenced in recent Scientific Reports work on self-driven microbial nutrient recovery — remain pilot-scale. Treat them as a 2027+ opportunity, not a 2026 procurement option. For 2026 capex, the proven stack is struvite reactor plus chemical dosing, with MBR upstream for nitrogen polishing and DAF upstream for phosphorus-containing solids pre-treatment. The comparison between MBR and conventional activated sludge for nutrient removal is detailed in the 2026 MBR vs CAS engineering comparison.
Driver 4 — ESG Capital, Green Bonds, and Struvite Offtake Contracts
Financing mechanisms are now mature enough to underwrite nutrient recovery capex without subsidy support. The EU Green Bond Standard (2024) and US Inflation Reduction Act provisions both create favorable financing terms for projects that include nutrient recovery as a measured environmental attribute, and CSRD disclosure rules in the EU make WWTPs with verified nutrient recovery more attractive to municipal bond investors.
On the revenue side, long-term fertilizer offtake contracts from struvite offtakers (Ostara, Nutrient Recovery Systems, and regional equivalents) lock in 5-10 year pricing and provide the revenue certainty that swings project IRR from marginal to bankable. For a municipal EPC consultant building the financial model, the practical question is no longer "is the technology proven" but "who buys the recovered product and at what floor price."
Drivers 5-7 — Water Reuse Mandates, Biogas Co-Recovery, and Geopolitical Reshoring
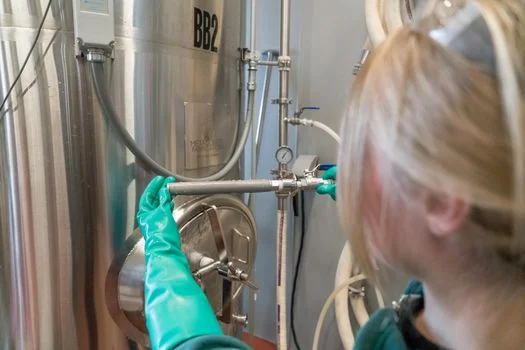
These remaining drivers align nutrient recovery with broader energy and water security goals.
Driver 5 (Water reuse mandates): The EU Water Reuse Regulation (2020/741) sets minimum quality requirements for reclaimed water and pushes N and P polishing as a precursor to potable and industrial reuse. Plants retrofitting for reuse compliance are the same plants now installing nutrient recovery, so the two capex lines collapse into a single procurement package.
Driver 6 (Biogas co-recovery economics): Anaerobic co-digestion paired with struvite recovery from digester centrate creates a circular nutrient-energy nexus — the digester produces biogas and the centrate becomes struvite reactor feed. The 2026 anaerobic vs aerobic digester comparison covers the selection logic, and the broader biogas from wastewater co-recovery analysis covers the market sizing.
Driver 7 (Geopolitical fertilizer reshoring): US and EU industrial policy under CHIPS-adjacent frameworks and the Net-Zero Industry Act classifies domestic fertilizer production as a strategic supply, and recovered nutrients from municipal WWTPs qualify as domestic supply. This driver has the longest capex trigger timeline (5+ years) but matters for long-horizon industrial strategists planning 2030+ capacity.
Driver Impact Matrix: Which Forces Actually Move Your Capex Decision
The table below scores each driver on three dimensions for 2026 procurement: regulatory weight (1-5 scale, where 5 is a binding compliance deadline), capex trigger speed (1-3 years, 3-5 years, 5+ years), and primary equipment impact.
| Driver | Regulatory Weight (1-5) | Capex Trigger Speed | Primary Equipment Impact |
|---|---|---|---|
| 1. EU UWWTD revision | 5 | 1-3 years | Struvite reactor, MBR, chemical dosing |
| 2. China GB standards | 5 | 1-3 years | Chemical dosing, DAF, MBR |
| 3. Phosphate rock scarcity | 4 | 1-3 years | Struvite reactor, chemical dosing |
| 4. Technology maturity | 2 | 1-3 years | Struvite reactor, MBR, membrane contactors |
| 5. ESG / green bond capital | 3 | 3-5 years | All nutrient recovery skids (financing layer) |
| 6. Water reuse mandates | 4 | 3-5 years | MBR, RO, chemical dosing |
| 7. Biogas co-recovery | 2 | 3-5 years | Anaerobic digester, struvite reactor on centrate |
| 8. Geopolitical reshoring | 2 | 5+ years | Long-horizon fertilizer production assets |
For municipal plants in the EU or China, Drivers 1-2-3 dominate the 2026 decision calendar. For industrial sites (food, paper, petrochemical, fertilizer manufacturers), Drivers 3-4-7 are the relevant cluster, with technology maturity and offtake contract certainty outweighing direct regulatory pressure.
Equipment Implications: Matching Your Plant to the Right Recovery Tech
The optimal technology stack depends on whether the binding constraint is P-removal compliance, N-removal with reuse, or P-recovery as a saleable product.