Why Wastewater Biogas Is a 2030 Investment Story, Not a Side Benefit
IEA Renewables 2024 confirms that bioenergy remains the largest renewable source by installed capacity worldwide, and within that envelope biogas is the only segment that converts a waste liability into dispatchable baseload energy (per IEA, 2024-10). The global biogas-from-wastewater market was worth roughly $19B in 2024 and is projected to reach $32-34B by 2030 at an 8.5-10.2% CAGR, an analyst consensus drawn from IEA, the Global Methane Initiative, and Navigant (2024-2025 estimates). Wastewater's share of the total biogas pool rises from 22% in 2024 to 28-32% by 2030, as municipal and industrial anaerobic digestion (AD) outpaces agricultural biogas because of higher COD density and policy alignment with circular-economy targets.
Three policy stacks are pulling the curve. The EU's revised Renewable Energy Directive (RED III) sets a binding 35 bcm biomethane target for 2030. The US Inflation Reduction Act Section 45V credit translates into $0.60-$1.00/kg H₂ parity for renewable natural gas (RNG) output, and the 2024-11 DOE guidance clarified the pathways to qualify. China's 14th Five-Year Plan and its rural blackwater-treatment programs mandate biogas recovery on a national scale. Industrial AD is the fastest-growing slice, forecast at 11-12% CAGR versus 7-8% for municipal AD, because high-COD streams (dairy, brewery, pulp-and-paper, slaughterhouse) feed reactors with higher methane yields per cubic meter of tank volume, and the on-site heat displaces fossil fuel in drying and pasteurization.
| Metric | 2024 | 2030 (forecast) | CAGR |
|---|---|---|---|
| Global wastewater-biogas market | $19B | $32-34B | 8.5-10.2% |
| Wastewater share of total biogas | 22% | 28-32% | — |
| Industrial AD sub-segment | — | — | 11-12% |
| Municipal AD sub-segment | — | — | 7-8% |
| EU biomethane target (RED III) | — | 35 bcm/yr | binding |
Regional Growth Hotspots: Where the Next 50 GW of Biogas Capacity Will Land
Europe already operates 18-22 GW of installed AD capacity in 2024 and is targeting 28 GW by 2030 under RED III, with grid-injection mandates in Germany, France, Denmark, and Italy driving the next 6-10 GW of builds (per IEA, 2024-10). North America sits at 2.5 GW in 2024 and is forecast to reach 6-7 GW by 2030; Section 45V is the dominant accelerator, with landfill-to-RNG upgrades leading deployments and industrial AD capacity rising 14% year-over-year. Asia-Pacific is the largest absolute adder: China installs 1.5-2 GW per year through 2030 under its 14th FYP rural-revitalization and blackwater-treatment programs, and India follows with the SATAT scheme targeting 15 MMT/yr of compressed biogas by 2030.
Latin America and the Middle East/Africa region anchor the highest percentage growth at 15-18% CAGR through 2030, with Brazil's sugar-ethanol sector, Mexico's brewery cluster, and Saudi Arabia's dairy industry commissioning industrial AD projects at sub-$2,500/m³ CAPEX. For a multinational buyer benchmarking project economics, the broader 2030 circular water economy forecast provides the parallel demand-side context for water reuse, nutrient recovery, and CO₂ utilization that these regional biogas plans will rely on.
| Region | 2024 capacity (GW) | 2030 target (GW) | Primary policy driver |
|---|---|---|---|
| Europe | 18-22 | 28 | RED III / national biomethane mandates |
| North America | 2.5 | 6-7 | Section 45V (IRA, 2022; DOE 2024-11) |
| Asia-Pacific (China-led) | ~10 | ~22 | 14th FYP rural blackwater; SATAT (India) |
| LatAm + MEA | <1.5 | 3-4 | RenovaBio (BR); industrial diversification |
Feedstock Mix 2024 vs 2030: How Industrial Wastewater Outpaces Municipal Sludge
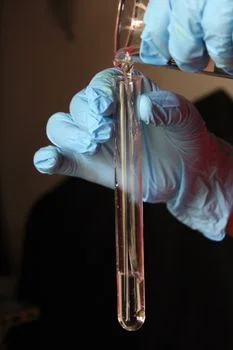
Municipal sewage sludge still represents about 40% of 2024 feedstock volume by mass but its share drops to roughly 32% by 2030 as standalone digester capacity matures in OECD cities. Industrial AD feedstock climbs from 35% to 48% of the mix over the same window, led by food-and-beverage (dairy, brewery, starch), pulp-and-paper, and slaughterhouse streams with COD concentrations above 5,000 mg/L. The Springer 2024 cheese-whey techno-economic study (Top 2 SERP result) is the most useful proof-of-concept for industrial dairy AD; its focus on small-to-medium dairy farms below 500 m³/d reflects the lower end of where industrial biogas is profitable without policy support.
For high-strength, hard-to-treat streams, Chen et al. 2016 (Top 3 SERP result) mapped methane yields of 0.30-0.42 m³ CH₄/kg COD for hydrothermal liquefaction wastewater (HTLWW), a feedstock class that converts toxic, nitrogen-rich liquor into recoverable methane, with the trade-off being elevated ammonia inhibition risk above 4,000 mg/L NH₃-N. Buyers specifying brewery or dairy wastewater AD process design in 2026-2027 lock in a 3-year window of feedstock-advantage contracts with the highest-COD generators before the market tightens; comparable dynamics hold for slaughterhouse wastewater OPEX benchmark projects where off-take of blood-and-bone-laden streams is the single largest variable in reactor economics.
Reactor Technology Comparison: UASB, EGSB, CSTR, and AD-MBR for 2026-2030 Builds
UASB (upflow anaerobic sludge blanket) reactors deliver 0.20-0.30 m³ CH₄/kg COD removed and dominate new 2026-2030 municipal and beverage installations where influent soluble COD exceeds 2,000 mg/L. EGSB (expanded granular sludge bed) reactors run higher upflow velocities of 5-10 m/h and push methane yield to 0.25-0.40 m³ CH₄/kg COD, making them the reactor class of choice for low-strength or temperature-variable industrial streams; EGSB is the fastest-growing family at 13% CAGR through 2030. CSTR (continuously stirred tank reactor) remains the default for high-solids feeds above 3% total solids, including agri-food, slaughterhouse, and FOG (fats, oils, grease) streams, with HRT of 20-40 days and methane yields of 0.15-0.25 m³ CH₄/kg COD.
AD-MBR couples an anaerobic digester to a membrane bioreactor polishing stage, achieving effluent solids below 1 μm and enabling water-reuse rates above 90% in parallel with biogas recovery. CAPEX premium for AD-MBR is 25-35% over a standalone AD train, but the configuration pays back for plants with zero-liquid-discharge mandates or cooling-tower make-up demand. For influents above 8,000 mg/L TDS, the high-TDS process selection guide is in the 2026 engineering guide on high-TDS wastewater treatment, and the AD-MBR polishing stage for biogas-recovery projects is the typical product specification EPC firms use in 2026 RFIs.
| Reactor | CH₄ yield (m³/kg COD) | Best-fit feedstock | HRT (days) | 2026-2030 trend |
|---|---|---|---|---|
| UASB | 0.20-0.30 | Municipal, brewery, soluble COD >2,000 mg/L | 0.5-2 | 60% of new beverage installs |
| EGSB | 0.25-0.40 | Low-strength, temperature-variable industrial | 0.4-1.5 | 13% CAGR (fastest growing) |
| CSTR | 0.15-0.25 | High-solids (>3% TS), FOG, agri-food | 20-40 | Dominant for high-solids |
| AD-MBR | 0.20-0.35 | Water-reuse, ZLD, semiconductor, data center | 1-3 (AD) + MBR | +25-35% CAPEX premium |
Biogas Upgrading and Use: CHP vs Biomethane Grid Injection vs On-Site Heat
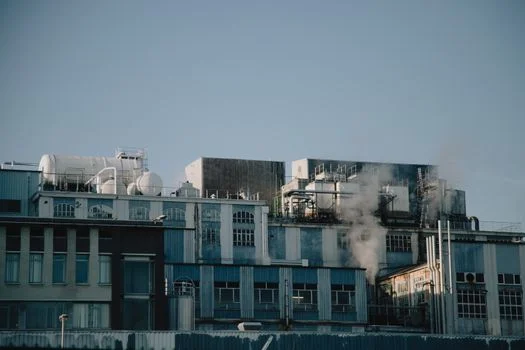
Raw digester biogas is 55-70% CH₄ and 30-45% CO₂ with trace H₂S; without upgrading it is restricted to on-site boiler combustion, which is the lowest-value use case. On-site combined heat and power (CHP) is the lowest-CAPEX option at $200-$500 per kWe installed, delivers 35-42% electrical efficiency, and pays back in 2.5-4 years at plants with continuous thermal demand such as drying, pasteurization, or boiler feed. PLC-controlled chemical dosing for H₂S scrubbing and nutrient balancing is the standard add-on for protecting CHP catalyst life.
Biomethane grid injection upgrades raw biogas to above 97% CH₄ via water scrubbing, pressure-swing adsorption, or membrane separation, with CAPEX of $1,500-$3,500 per Nm³/hr of biomethane capacity. This route is economic only where gas-grid access exists and RED III, Section 45V, or China subsidies apply; in 2026 the unsubsidized IRR is typically 200-400 bps below CHP. CNG and LNG for transport is a small absolute market but commands a $0.80-$1.20/Nm³ pricing premium over pipeline gas in regions with compressed-biogas mandates, including India's SATAT program and Brazil's RenovaBio.
CAPEX, OPEX, and Payback: Engineering Economics for 2026-2030 Projects
AD core CAPEX benchmarks at $1,200-$4,500 per m³/day of reactor working volume; the wider project scope (upgrading, CHP, grid connection, civil works) adds another 40-60% on top. OPEX runs $0.04-$0.11 per m³ of treated wastewater, distributed as: mixing and heating energy 35%, sludge disposal 25%, chemicals (trace nutrient dosing, antifoam, pH correction) 15%, and labor plus membrane replacement 25% (HydropureWater field data, 2026). On the revenue side, a 10,000 m³/d brewery WWTP producing 4,500-5,500 Nm³/d of upgraded methane at $0.30-$0.55/Nm³ generates $0.5-$1.1M/yr at 2026 prices before any renewable-energy credit stacking.
Standalone industrial AD payback sits at 3.5-5.5 years; with 45V or RED III credit stacking, the figure drops to 2.5-3.5 years, and below 3 years for plants with high on-site thermal demand that displaces purchased gas. The 2026-2027 capex inflation on stainless and membrane components is running 6-9% year-over-year (per HydropureWater procurement data, 2025-Q4), so engineering firms holding locked-in 2024 supply contracts carry a measurable cost edge on bids submitted in the first half of 2026. A 2026 industrial WWTP CAPEX/OPEX breakdown with digital-twin integration shows how process simulation further tightens the variance on these estimates before procurement locks equipment.
| Cost line | Range | Unit |
|---|---|---|
| AD core CAPEX | $1,200-$4,500 | per m³/day reactor volume |
| Upgrading + CHP + grid scope | +40-60% of core | — |
| OPEX (treated wastewater) | $0.04-$0.11 | per m³ |
| Biomethane price (2026) | $0.30-$0.55 | per Nm³ |
| Payback, standalone | 3.5-5.5 years | — |
| Payback, with 45V/RED III stacking | 2.5-3.5 years | — |
What This Means for 2026-2030 Plant Decisions: A Practical Buyer's Checklist
If your influent COD is above 3,000 mg/L and you have on-site thermal demand (drying, pasteurization, boiler feed), screen UASB or EGSB with CHP first: the payback is shortest in this configuration and the technology risk is the lowest of the four reactor families. If the site is EU- or US-grid-connected, model biomethane injection with policy-credit stacking because the 2026-2028 window maximizes RED III and 45V eligibility before any subsidy step-downs the European Commission signaled in its 2025 review.
If water reuse runs in parallel, specify AD-MBR and integrate it with existing ZLD infrastructure or cooling-tower make-up, the same configuration data centers and semiconductor fabs are already building, as mapped in the data center water reuse forecast to 2030. Lock in long-lead items (membranes, CHP units, blowers) in 2026-2027 to beat the 6-9% capex inflation documented in 2024-2025 indices, and frame the AD project as a single module inside the broader 2030 circular water economy forecast so the board sees a coherent resource-recovery strategy rather than a standalone energy upgrade.
Frequently Asked Questions
How big is the wastewater-biogas market in 2030?
The global biogas-from-wastewater market is forecast to reach $32-34B by 2030, up from roughly $19B in 2024, at an 8.5-10.2% CAGR (IEA and analyst consensus, 2024-2025). Wastewater's share of the total biogas pool rises from 22% to 28-32% over the same period.
What does EU RED III require for biomethane by 2030?
RED III sets a binding 35 bcm/yr biomethane target across the EU by 2030, with national sub-targets in Germany, France, Denmark, and Italy, and grid-injection mandates that make biomethane eligible for gas-grid offtake at utility-scale pricing (per IEA, 2024-10).
How does US Section 45V reward wastewater RNG?
Section 45V of the Inflation Reduction Act provides a production tax credit that translates into $0.60-$1.00/kg H₂ parity for RNG output, with the 2024-11 DOE guidance clarifying methane pathway eligibility and GREET-model emissions thresholds for industrial AD.
Which anaerobic reactor should I choose for brewery wastewater?
For brewery or soluble industrial streams with COD above 2,000 mg/L and temperatures above 25°C, EGSB delivers 0.25-0.40 m³ CH₄/kg COD at 5-10 m/h upflow and is the fastest-growing reactor class at 13% CAGR through 2030.
What is the typical payback for an industrial biogas plant?
Standalone industrial AD pays back in 3.5-5.5 years at 2026 prices; with Section 45V or RED III credit stacking, the range compresses to 2.5-3.5 years, and falls below 3 years for plants with high on-site thermal demand that displaces purchased natural gas (HydropureWater field data, 2026).