What Slaughterhouse Wastewater Treatment Actually Costs to Run
Slaughterhouse wastewater plant operating cost in 2026 typically falls between $0.18 and $0.85 per m³ treated at plants in the 200–1,000 m³/d range, driven primarily by aeration energy, sludge hauling, and polymer consumption. High FOG and blood loading (COD up to 375,000 mg/L in blood streams per the ScienceDirect slaughterhouse-waste overview, 2024) elevates both energy demand and biosolids yield, so well-designed DAF pre-treatment combined with MBR polishing can cut OPEX by 20–35% versus conventional activated sludge at the same discharge limit.
Four cost buckets account for virtually the entire OPEX envelope:
- Energy 40–55% — dominated by aeration blower power and, on MBR trains, membrane air-scour.
- Sludge disposal 20–30% — dewatering consumables, hauling, and tipping fees.
- Chemicals 10–20% — DAF and dewatering polymer, coagulants for P polishing, and pH control.
- Labor + maintenance 10–20% — operator hours plus instrument calibration, diffuser replacement, and membrane CIP.
The range is wide because slaughterhouse OPEX is structurally higher than municipal sewage. Influent COD routinely lands between 4,000 and 13,000 mg/L, with BOD₅ between 2,000 and 6,500 mg/L and FOG between 200 and 1,500 mg/L, according to the Musa & Idrus 2021 review in Sustainability 13:4656. Batch processing means flows and loads swing 3–5× across a shift, and the cleaning chemicals (caustic, quaternary ammonium sanitizers) that enter the drain push TDS and inhibit nitrification unless equalized. A 500 m³/d plant running at a blended $0.42/m³ OPEX spends roughly $77,000 per year — a useful sanity check before a vendor's quote is opened.
The Four Cost Drivers and the Engineering Behind Each
Every line item on a slaughterhouse OPEX sheet traces back to a design or operating parameter that the engineer controls. Knowing which knob to turn is the difference between a defensible budget and a recurring overrun.
| Cost Driver | Key Engineering Parameter | Low / Typical / High | OPEX Lever |
|---|---|---|---|
| Energy — aeration | kWh per kg BOD removed (AS) | 0.8 / 1.4 / 1.8 | DO setpoint, SOTE, MLSS, F/M ratio |
| Energy — MBR air-scour | kWh per m³ permeate | 0.25 / 0.45 / 0.70 | Membrane flux, relaxation cycle, MLSS |
| Chemicals — DAF polymer | Anionic polyacrylamide dose (mg/L) | 3 / 6 / 10 | FOG fraction, recycle ratio, micro-bubble sizing |
| Chemicals — WAS conditioning | Cationic polymer (kg/dry ton) | 8 / 11 / 15 | Bound FOG, cake target DS%, pre-thickening |
| Chemicals — P polishing | FeCl₃ dose (mg/L) | 50 / 110 / 200 | Discharge P limit, influent ortho-P |
| Sludge — yield | kg DS per kg BOD removed | 0.45 / 0.55 / 0.65 | SRT, FOG removal upstream, sludge age |
| Sludge — dewatering | Cake dryness (%) | 22 / 25 / 28 | Polymer dose, press pressure, pre-thickener |
| Labor | FTE per shift (500 m³/d) | 0.5 / 1.0 / 1.5 | SCADA, online sensors, membrane automation |
On the energy side, aeration dominates: coarse-bubble diffusers deliver 20–30% standard oxygen transfer efficiency (SOTE) versus 35–50% for fine-bubble membranes, and a properly designed MBR can run at 0.8–1.2 kWh/kg BOD removed against 1.2–1.8 kWh/kg for conventional activated sludge (HydropureWater field data, 2026). Chemicals center on polymer — 3–10 mg/L anionic polyacrylamide in the dissolved air flotation (DAF) system stage and 5–15 mg/L cationic for waste-activated-sludge conditioning — with 50–200 mg/L FeCl₃ when phosphorus polishing to under 1 mg/L is required. Sludge yield is the line item most teams underestimate: slaughterhouse WAS runs 0.45–0.65 kg DS per kg BOD removed, 50–80% above the 0.30–0.40 municipal range, because bound FOG and blood proteins codify into the floc. Labor scales at 0.5–1.5 FTE per shift for a 500 m³/d plant; full SCADA and online MLSS/DO probes can drop that toward 0.5 FTE but add $8,000–$15,000/year in instrument spares. Purple phototrophic bacteria have demonstrated 92% C, 70% N, and 91% P removals under IR light (Mata-De-la-Vega et al., 2022), so flag the PPB route as a 2027–2028 OPEX option, not a 2026 spend.
How Treatment Configuration Changes Operating Cost
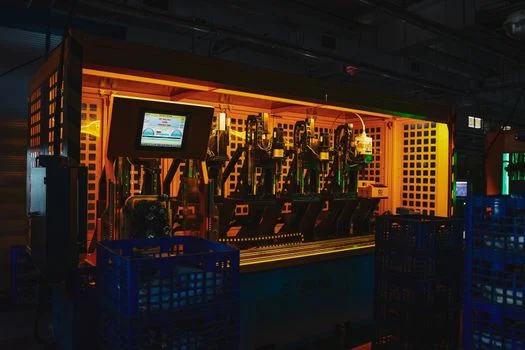
The train you pick moves OPEX more than any other decision once flow is fixed. Three configurations cover roughly 90% of new abattoir builds in 2026: DAF plus conventional activated sludge, DAF plus MBR, and DAF plus SBR. The table below benchmarks them at 500 m³/d, 6,000 mg/L COD influent, 30 mg/L BOD discharge.
| Configuration | Energy ($/m³) | Chemicals ($/m³) | Sludge ($/m³) | Labor ($/m³) | Blended OPEX ($/m³) | Best Fit |
|---|---|---|---|---|---|---|
| DAF + Conv. AS | 0.18 | 0.05 | 0.10 | 0.05 | 0.38 | Loose TSS limit (>30 mg/L), low labor cost region |
| DAF + MBR | 0.24 | 0.04 | 0.07 | 0.04 | 0.39 | Tight limits (TSS <5, NH₃ <2), water reuse, footprint-constrained sites |
| DAF + SBR | 0.16 | 0.05 | 0.09 | 0.03 | 0.33 | Flows under 300 m³/d, batch-friendly, no continuous effluent polish needed |
MBR adds roughly $0.05–$0.10/m³ in membrane air-scour and CIP energy but recovers $0.08–$0.15/m³ through eliminated secondary clarifier sludge, lower polymer on the downstream side, and the option to reuse permeate for yard wash — which is why the blended OPEX gap is narrower than vendors admit. SBR wins on labor and energy at sub-300 m³/d flows because decanter cycles and intermittent aeration remove the need for a separate clarifier, but it loses the polishing edge of an MBR membrane bioreactor system on TSS and cannot easily hit a 5 mg/L TSS reuse target. For sites with an existing grit and screening stage, the rotary mechanical bar screen protects downstream aeration tanks from hair, paunch, and bone fragments that otherwise blow diffuser membranes in under 18 months. Anaerobic pre-treatment (UASB or IC) front-end cuts aeration OPEX 30–50% by removing 60–75% of the COD upstream, but it adds biogas management complexity, flame arrestors, and a 2–3 year payback — flag it as a follow-up decision once the basic OPEX model is signed off.
Sludge Disposal — The Cost Line Most Budgets Underestimate
Sludge is the second-largest line item and the one that drifts the most across the asset life. A plate-and-frame filter press targets 22–28% dry solids cake, and tipping fees in most North American and EU jurisdictions run $40–$120 per wet ton hauled — so every additional point of dryness saved at the press translates directly into fewer trucks on the road. Polymer conditioning for slaughterhouse WAS demands 8–15 kg polymer per dry ton, roughly twice the dose for mixed municipal sludge, because emulsified FOG coats the floc surface and starves the cationic sites. Pre-thickening the WAS to 2.5–3.5% DS before the press cuts polymer by 20–30% and lets the press hit 26–28% cake. FOG-driven yield keeps pushing solids output upward: a 20% FOG increase from a new cutting line lifts WAS volume 8–12% with no change in flow, which means sludge OPEX climbs every year the line runs heavier. The sludge disposal cost optimization guide walks through seven engineering levers — pre-thickening, press selection, polymer selection, equalization, FOG capture upstream, dewatering centrate recycle, and cake washing — that together cut sludge OPEX 30–60% in documented abattoir retrofits.
Five-Year OPEX Projection: A Worked Example
Translating $/m³ into a multi-year budget is what unlocks finance approval. The table below shows a 500 m³/d plant starting at $0.42/m³ blended OPEX, with energy escalating 3% per year and sludge disposal escalating 5% per year (the higher number reflects regional tipping-fee pressure and FOG-driven yield growth); chemicals and labor are held flat at 2% general inflation.
| Year | Energy ($) | Chemicals ($) | Sludge ($) | Labor+Maint. ($) | Annual OPEX ($) | Cumulative ($) |
|---|---|---|---|---|---|---|
| 1 | 38,300 | 13,700 | 18,300 | 11,000 | 81,300 | 81,300 |
| 2 | 39,400 | 14,000 | 19,200 | 11,200 | 83,800 | 165,100 |
| 3 | 40,600 | 14,300 | 20,200 | 11,400 | 86,500 | 251,600 |
| 4 | 41,800 | 14,600 | 21,200 | 11,600 | 89,200 | 340,800 |
| 5 | 43,100 | 14,900 | 22,300 | 11,800 | 92,100 | 432,900 |
Cumulative 5-year OPEX lands at $432,900 in this conservative case; plants with FOG spikes or no pre-thickening commonly reach the $1.4–1.8M cumulative range when the same assumptions are applied to 2,000 m³/d flow. An automatic chemical dosing system keeps polymer and coagulant within ±5% of setpoint, which is the single most reliable way to stop chemicals from drifting into the high end of the range.
Frequently Asked Questions
What is the average operating cost of a slaughterhouse wastewater treatment plant?
A 200–1,000 m³/d abattoir WWTP runs $0.18–$0.85/m³ in 2026, with a 500 m³/d plant at typical FOG loading landing near $0.42/m³ blended (HydropureWater field data, 2026).
How much does sludge disposal add to slaughterhouse WWTP OPEX?
Sludge hauling and tipping typically account for 20–30% of total OPEX, or $0.07–$0.18/m³, driven by FOG-bound WAS yield of 0.45–0.65 kg DS per kg BOD removed.
Is MBR cheaper to run than conventional activated sludge for abattoirs?
At a 5 mg/L TSS or water-reuse discharge limit, MBR blended OPEX is within $0.01–$0.04/m³ of conventional AS because membrane air-scour cost is largely offset by eliminated clarifier sludge.
How much does FOG loading affect operating cost?
A 20% FOG increase pushes OPEX up 8–12% at constant flow, mostly through higher WAS yield and polymer dose on the dewatering press.
Can slaughterhouse wastewater be recycled for reuse?
Yes — DAF followed by MBR or ultrafiltration typically reaches irrigation or yard-wash reuse quality; see the meat processing wastewater recycling system guide for spec details.