Why Nutrient Recovery Is a 2030 Industrial Priority
Phosphorus is mined, not synthesized, and global rock phosphate reserves are concentrated in three jurisdictions — Morocco (~70% of known reserves), China, and the United States. Any facility dependent on phosphate-based fertilizers or phosphorus-bearing process chemicals faces structural supply-chain risk that has been documented since 2001. Bennett et al. (Bioscience 51:227–234) framed the dual crisis: phosphorus mining accelerates reserves depletion while agricultural runoff drives freshwater and coastal eutrophication, and that framing remains the cited baseline in 2025–2026 EU and US regulatory filings. Recovery of nitrogen and phosphorus from industrial and municipal wastewater is the only mechanism that addresses both problems at once.
The market signal is clear. The global nutrient recovery market is forecast to grow from approximately $5.2 billion in 2024 to $8.4 billion by 2030, expanding at a 7.1% CAGR. Industrial facilities — food and beverage, fertilizer manufacturing, pharmaceutical, and livestock processing — account for the fastest-growing segment of that expansion, ahead of municipal water resource recovery facilities (WRRFs). Ammonia air stripping from high-strength streams, characterized by Bonmatí and Flotats (Waste Manag 23:261–272, 2003) as a pre- or post-mesophilic anaerobic digestion step, remains a cost-effective nitrogen recovery option for streams with NH₄-N above 1,500 mg/L.
Regulatory pull is now codified in three major jurisdictions. The EU Nitrates Directive (91/676/EEC), the revised Urban Waste Water Treatment Directive, and the EU Critical Raw Materials Act (2024) — which lists phosphate rock as a strategic raw material — are forcing European municipal and industrial sites to plan recovery. China's Action Plan for Prevention and Control of Water Pollution (the "Ten-Point Water Plan," continuing under the 14th Five-Year Plan) enforces total phosphorus and ammonia limits that effectively mandate recovery from agro-industrial streams. The US Nutrient Recycling Challenge (USDA/EPA, launched 2018, expanded in 2024–2025) and tightening state-level limits in Florida, the Chesapeake Bay watershed, and California's Central Valley are now backed by enforcement and funding.
The Four Technology Pathways for Industrial Nutrient Recovery
Industrial buyers evaluating nutrient recovery through 2030 should be familiar with four technology families. Each occupies a defined range of influent concentrations, capital intensity, and product marketability.
Chemical precipitation produces struvite (MgNH₄PO₄·6H₂O), magnesium ammonium phosphate (MAP), or vivianite (Fe₃(PO₄)₂·8H₂O) by dosing magnesium, iron, or both into phosphorus-rich streams. Struvite reactors recover 80–95% of phosphorus and 10–30% of co-precipitated nitrogen from anaerobic digester centrate, dewatering liquor, or high-P industrial streams. The process is proven at full scale, with over 80 documented municipal and industrial installations worldwide. Vivianite recovery from iron-dosed sludge is an emerging pathway documented in Dutch and German municipal projects since 2022.
Electrochemical recovery uses electrodialysis, bipolar membrane electrodialysis, or membrane capacitive deionization to concentrate ammonium and phosphate ions to 5–10% w/w, suitable for downstream liquid fertilizer formulation. A 2020 hybrid electrochemical study published in RSC's Environmental Science: Water Research & Technology (c9ew00981g) demonstrated combined bipolar-membrane electrodialysis with membrane capacitive deionization for nutrient concentration from treated effluent. OPEX is dominated by electrode replacement and electrical input; CAPEX is roughly 5–10× higher than chemical precipitation per kg of nutrient recovered.
Biological recovery uses algae-bacteria consortia or methanotroph co-cultures (notably Methylococcus capsulatus) to convert ammonium and methane into single-cell protein. The 2018 ScienceDirect study by Rasouli et al. on a M. capsulatus co-culture system reported protein productivity of 0.18–0.34 g/L·day from a synthetic high-strength stream. Biological recovery remains at pilot-to-demonstration scale, and product pathways are split between animal feed (regulatory pathway clearer in the EU since 2022) and soil amendment.
Membrane and ion-exchange recovery — natural and engineered zeolites for selective ammonium binding, nanofiltration for divalent phosphate, and reverse osmosis for total nutrient polishing — typically sits downstream of chemical precipitation as a polishing or concentration step. For high-salinity industrial streams, the engineering selection logic mirrors the selection process described in this high TDS wastewater treatment guide.
| Technology | Recovery Rate (P / N) | Relative CAPEX | Relative OPEX | Scalability (2026) | Typical Influent Strength |
|---|---|---|---|---|---|
| Chemical precipitation (struvite/MAP/vivianite) | P: 80–95% / N: 10–30% | Low | Low | Full scale (commercial) | 50–500 mg/L PO₄-P; 500–3,000 mg/L NH₄-N |
| Electrochemical (ED, BMED, MCDI) | P: 70–90% / N: 60–85% | High | Medium–High | Demo to early commercial | 20–200 mg/L P; 50–500 mg/L N |
| Biological (algae / methanotrophs) | N: 50–80% (P variable) | Medium | Low–Medium | Pilot–demonstration | 20–300 mg/L NH₄-N; low C/N preferred |
| Membrane / ion exchange (zeolite, NF, RO) | P: 60–95% / N: 50–90% | Medium–High | Medium | Full scale (commercial) | 5–100 mg/L P/N (polishing); 200–2,000 mg/L (NF/RO) |
Struvite, Ammonium Sulfate, and Vivianite: What You Actually Recover
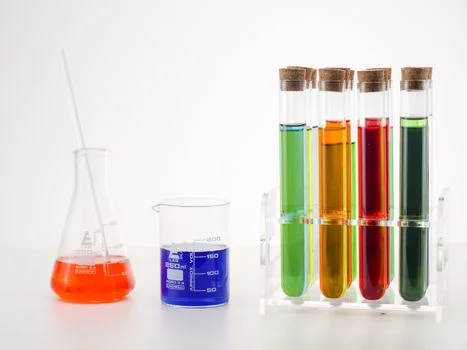
The product coming off a recovery unit determines whether the line item is a cost center or a revenue line. Three products dominate the 2026 industrial landscape.
Struvite (MgNH₄PO₄·6H₂O) is a slow-release granular fertilizer with 5.7% N, 12.6% P, and 9.9% Mg by mass. Marketable price ranges from $200 to $500 per ton depending on purity (technical grade vs. fertilizer grade) and regional demand. Struvite recovery is economically viable when influent molar N:P ratios approach 1:1, when magnesium dosing (typically MgCl₂) costs are contained, and when the recovered product can displace purchased phosphate fertilizer on-site or under contract.
Ammonium sulfate ((NH₄)₂SO₄) is produced by air stripping ammonia from high-strength liquor and scrubbing the strip-gas into sulfuric acid. The resulting 8% N liquid product is marketable at $80 to $180 per ton as a liquid fertilizer or as a precursor to industrial (NH₄)₂SO₄ crystals (21% N, $250–$400/ton). Air stripping is the correct choice for N-dominant streams — digester supernatant, landfill leachate, livestock slurry, and high-strength pharmaceutical or fertilizer plant condensates.
Vivianite (Fe₃(PO₄)₂·8H₂O) is an emerging phosphorus product from iron-dosed wastewater and sludge streams. Market price benchmarks are still developing, but vivianite recovered from sewage sludge is attracting interest as both a soil amendment (28% P₂O₅ equivalent on a dry basis) and as a precursor feedstock for lithium-iron-phosphate (LFP) battery cathode production. A 2024–2025 EU demonstration project at a Dutch WRRF reported vivianite recovery rates of 60–75% from iron-dosed dewatering liquor.
The influent N:P molar ratio is the dominant gatekeeper: struvite requires roughly 1:1 N:P, ammonium sulfate recovery is economic for N:P above 3:1, and vivianite is feasible when iron is already being dosed upstream (typical of phosphorus removal plants).
Market Forecast 2024–2030 by Region and End-Use
Asia-Pacific holds the largest regional share of the nutrient recovery market and is growing fastest. China's 14th Five-Year Plan water pollution control targets — specifically, the 2025 TP discharge caps for industrial parks and the ongoing retrofit of municipal WRRFs with TP ≤ 0.3 mg/L — are driving 8.5–9% annual market growth in the region through 2030. India's Namami Gange program has funded nutrient recovery pilots in the Ganges basin since 2023. The regional split for 2024–2030 also reflects the broader circular water economy forecast to 2030.
Europe holds the second-largest share. Drivers include the EU Nitrates Directive (91/676/EEC), the revised Urban Waste Water Treatment Directive (91/271/EEC, recast 2024), and the EU Critical Raw Materials Act listing phosphate rock as a critical raw material in March 2024. The Netherlands, Germany, Denmark, and Switzerland have the highest installed recovery capacity per capita.
North America is accelerating, with growth driven by the US Nutrient Recycling Challenge (USDA/EPA), state-level phosphorus limits in Florida (Chapter 62-4 FAC), and the Chesapeake Bay TMDL jurisdiction enforcement. Installed capacity grew 12% year-on-year in 2024–2025, mostly in municipal WRRFs but with a sharp uptick in dairy and food-processing industrial sites.
By end-use, municipal WRRFs account for approximately 60% of installed capacity in 2024, but industrial segments — food and beverage, fertilizer manufacturing, pharmaceuticals, and livestock — are growing 1.5–2× faster and are projected to reach 45% of installed capacity by 2030.
Industrial Integration: Where Nutrient Recovery Fits in the Treatment Train
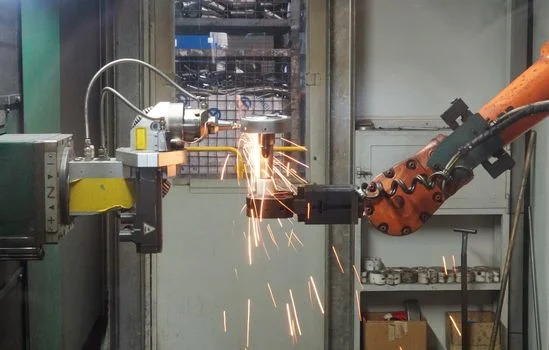
Placement of a recovery unit within an existing wastewater train determines both capital cost and achievable recovery rate. The four common integration points are well documented across the engineering literature.
Struvite reactors are typically installed on the centrate or dewatering liquor return line from sludge dewatering — screw press or belt filter press filtrate, centrifuge centrate. This stream carries 50–80% of the influent phosphorus concentrated in 2–5% of the total flow, which is why struvite recovery is the highest-impact first unit for plants with anaerobic digestion. Chemical precipitation requires automated MgCl₂ and NaOH dosing; an automatic chemical dosing system with PID pH control (target 7.5–8.5) and Mg:P molar ratio control (target 1.3:1) is standard.
Air stripping columns for ammonia recovery are placed either upstream of mesophilic anaerobic digestion (to reduce ammonia inhibition in the digester) or downstream of dewatering (on the centrate). The Bonmatí and Flotats 2003 study documented pre-digestion stripping of pig slurry as a feasible configuration with NH₄-N removal efficiencies of 75–90% using air flows of 1,500–3,000 m³/m³ slurry.
Electrochemical systems are best installed on clarified secondary effluent or RO concentrate, where TDS is moderate (2,000–10,000 mg/L) and nutrients are dilute but recoverable. They are not cost-effective on raw influent.
Upstream solids and oil removal is non-negotiable for any membrane or electrochemical unit. A DAF system rated for TSS ≤ 50 mg/L on the feed stream protects downstream membrane surface area, and a lamella clarifier handles the bulk settling before DAF polishing in high-flow industrial applications.
CAPEX and OPEX Ranges: Building the Business Case
The 2026 cost ranges below are compiled from publicly available project data and engineering estimates for industrial-scale installations in the 1–50 ton-per-day nutrient-recovery range. Per-kg capacity normalization is the most useful metric for comparing technologies of different throughputs.
| Technology | CAPEX (USD per kg N+P recovered/day) | OPEX (USD per kg recovered) | Payback (no incentive) | Payback (with credit/contract) |
|---|---|---|---|---|
| Struvite precipitation | $200–$900 | $0.05–$0.20 | 5–8 years | 3–5 years |
| Air stripping + acid scrub | $300–$1,200 | $0.08–$0.25 | 5–9 years | 3–5 years |
| Electrochemical (ED/BMED/MCDI) | $1,500–$4,000 | $0.30–$0.70 | 7–12 years | 4–7 years |
| Membrane / ion exchange (NF/RO/zeolite) | $800–$2,500 | $0.15–$0.45 | 6–10 years | 3–6 years |
Revenue from struvite and ammonium sulfate sales typically offsets 15–35% of OPEX at current 2026 fertilizer prices, with the higher end of that range realized where the recovered product displaces on-site fertilizer purchases. The economics shift meaningfully when tipping fees, renewable nutrient credits, or guaranteed offtake contracts are layered in — payback compresses from the 5–9 year band to 3–5 years in those scenarios. The same CAPEX/OPEX framing logic applied to digital-twin retrofit economics in this digital twin cost in 2026 for industrial WWTPs breakdown applies here: equipment-dominated line items versus operating cost driven by consumables and energy.
Frequently Asked Questions
What is the size of the global nutrient recovery market in 2024 and 2030?
The global nutrient recovery market is forecast at approximately $5.2 billion in 2024, expanding to $8.4 billion by 2030 at a 7.1% CAGR. The industrial segment — food, fertilizer, pharma — is the fastest-growing contributor to that expansion, outpacing municipal WRRF upgrades.
Which technology is most cost-effective for industrial nutrient recovery?
Chemical precipitation (struvite, MAP, vivianite) remains the lowest CAPEX and OPEX option at $200–$900 per kg N+P recovered per day CAPEX and $0.05–$0.20 per kg OPEX. Air stripping with acid scrub is the parallel cost-effective choice for N-dominant streams at $300–$1,200 per kg N/day CAPEX.
What is the payback period for an industrial nutrient recovery unit?
Payback for a full-scale struvite or air-stripping installation at an industrial site is 5–9 years without nutrient credits or fertilizer offtake contracts, dropping to 3–5 years when tipping fees, government incentives, or guaranteed fertilizer sales contracts are in place.
Which regulatory frameworks are driving nutrient recovery adoption through 2030?
Three frameworks anchor regional adoption: the EU Nitrates Directive (91/676/EEC) and EU Critical Raw Materials Act (2024), China's Action Plan for Prevention and Control of Water Pollution (10-Point Water Plan, 14th Five-Year Plan), and the US Nutrient Recycling Challenge (USDA/EPA) combined with state-level phosphorus limits in Florida and the Chesapeake Bay TMDL jurisdiction.