Why Wafer Fabs Adopt Zero Liquid Discharge
A wafer fab ZLD hybrid FO-NF-MVR train recovers about 90–95% of high-TDS process water at 5–15 LMH FO flux. A 150 m³/h module typically costs $8M–$12M CAPEX with OPEX of $0.80–$2.50/m³. Fluoride discharge targets range from 1.5 mg/L in EU practice to 10 mg/L under China SEPA new-fab Table 3 rules.
Advanced wafer fabs draw 5–10 million gallons of water per day (MGD), and 2 nm–3 nm campuses were projected to exceed 15 MGD by 2025 (IEEE 2024). Freshwater in Arizona, Taiwan, and Singapore often costs $2.50–$6.00/m³. Onsite reclaimed water from Zero Liquid Discharge usually lands at $0.50–$1.50/m³ (HydropureWater field data, 2025). China’s SEPA Table 3 standards for new fabs cite fluoride as low as 10 mg/L and TDS below 2,000 mg/L. The U.S. EPA primary fluoride MCL remains 4.0 mg/L, with a secondary MCL of 2.0 mg/L for aesthetic effects.
EU Industrial Emissions Directive practice often targets about 1.5 mg/L fluoride and TDS below 1,500 mg/L. Procurement teams also use 2025 IRS CHIPS Act guidance for a 30% tax credit on industrial water-reuse infrastructure. That credit can pull a 10 MGD fab’s five-year ROI under four years when discharge fees and UPW make-up costs are counted. Stream segregation for HF, CMP, and brine remains the first design gate.
| Region/Standard | Fluoride Limit (mg/L) | TDS Limit (mg/L) | Regulatory Driver |
|---|---|---|---|
| U.S. EPA (Primary) | 4.0 | N/A | Safe Drinking Water Act |
| EU (IED) | 1.5 | < 1,500 | Industrial Emissions Directive |
| China SEPA | 10.0 | < 2,000 | Table 3 Standards (New Fabs) |
| Taiwan (TSMC Internal) | < 5.0 | < 1,000 | Corporate Sustainability Mandate |
Wafer Fab Wastewater Streams: Contaminant Profiles and Treatment Challenges
HF acid wastewater in semiconductor lines typically carries 100–1,000 mg/L fluoride. Multi-stage neutralization is required to meet sub-10 mg/L discharge targets. Calcium chloride (CaCl2) and sodium hydroxide (NaOH) precipitate calcium fluoride (CaF2). Silica co-precipitation fouls membranes unless flocculation is tightly controlled.
CMP wastewater shows TSS of 500–3,000 mg/L and copper at 10–50 mg/L. Backgrind wastewater can hold silicon dust up to 50,000 mg/L TSS. Those loads need lamella clarifiers sized for fast settling. Emerging rules on PFAS treatment in semiconductor developer wastewater push adsorption or advanced oxidation toward the 2025 EPA MCL of 4 ppt for PFOA and PFOS.
| Wastewater Stream | Key Contaminants | Concentration Range | ZLD Treatment Challenge |
|---|---|---|---|
| HF Wastewater | Fluoride, Silica | 100–1,000 mg/L F- | CaF2 scaling & silica fouling |
| CMP Wastewater | Alumina, Silica, Cu | 500–3,000 mg/L TSS | Abrasive particles; membrane wear |
| Backgrind Waste | Silicon Dust, Ni | 10,000–50,000 mg/L TSS | High solids loading; sludge volume |
| High-TDS Brine | NaCl, KCl, Organics | 50,000–150,000 mg/L TDS | Osmotic pressure exceeding RO limits |
How Do You Size Wastewater Treatment Equipment for ZLD?
Wastewater treatment equipment size for fab ZLD is set from peak hydraulic load, peak fluoride and TDS mass rates, and the recovery target—not from average daily flow alone. Most plants we size for 150 m³/h campus modules run membranes at the lower FO flux band of about 5–8 LMH when silica is high. Designers convert 300 mm fab tool dumps into m³/h (US gpd) cases with a 1.2–1.5 peaking factor. Clarifier area, FO/NF area, and MVR duty then lock to the worst-case brine TDS of 50,000–150,000 mg/L.
Use this selection checklist before freezing equipment size. Segregate HF, CMP, backgrind, and developer streams. Measure silica and calcium that drive CaF2 and CaSO4 scale. Set recovery, typically 90–95% for FO-NF-MVR. Size solids handling for crystallizer cake moisture below 5%. Confirm UPW make-up offset from distillate quality. Reserve CIP chemical and downtime envelopes. Align Scada I/O with existing fab utilities.
Compact campuses sometimes place an Underground Package Sewage Treatment Plant (WSZ Series) for non-process sanitary flows. That keeps the ZLD skid dedicated to high-TDS process brine. Mixing sanitary BOD into the brine train only inflates MVR steam economy and sludge volume.
Wafer Fab ZLD System Components: How FO, NF, and MVR Work Together
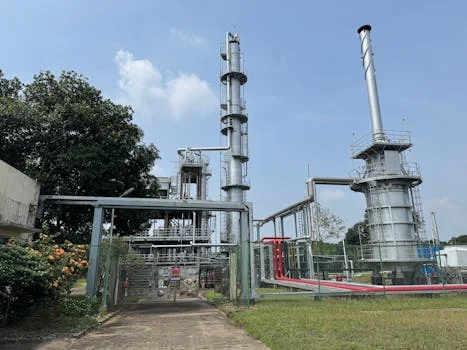
Forward osmosis membranes in hybrid ZLD trains typically run at 5–15 LMH. They use osmotic drive rather than high hydraulic pressure to concentrate high-TDS brines. A 2M NaCl draw solution pulls clean water across the membrane and rejects 99%+ of heavy metals and complex organics. Upstream, a DAF system for TSS removal in wafer fab wastewater protects FO from particulate fouling.
Nanofiltration then polishes permeate. It rejects 90–98% of divalent ions such as calcium and magnesium at about 0.5–1.2 kWh/m³. Mechanical vapor recompression finishes concentration to 20–30% TDS. MVR uses roughly 0.02–0.05 kWh per kg water evaporated, equal to 20–50 kWh/m³ of distillate. For organic-heavy pretreatment, DF series PVDF membranes for ultrafiltration in ZLD pretreatment provide a 0.02 µm barrier and target SDI below 3 ahead of thermal stages.
| Component | Primary Function | Technical Specification | Energy Consumption |
|---|---|---|---|
| Forward Osmosis (FO) | Brine Concentration | Flux: 5–15 LMH; 99% Rejection | Low (Osmotic driven) |
| Nanofiltration (NF) | Divalent Ion Removal | 90–98% Sulfate Rejection | 0.5–1.2 kWh/m³ |
| MVR Evaporator | Thermal Evaporation | Concentrate to 30% TDS | 20–50 kWh/m³ (distillate) |
| Crystallizer | Solid Salt Production | Moisture Content < 5% | High (Phase change) |
Hybrid Design: Comparing FO-NF-MVR, RO-MVR, and EDR-Crystallizer
Hybrid FO-NF-MVR architectures reach up to 95% water recovery on high-TDS semiconductor brines. Standard RO-MVR trains often struggle once recovery pushes past about 75% without aggressive pretreatment. High-pressure RO can exceed 1,200 psi on concentrated fluoride salts. For HF-rich streams, FO-NF-MVR avoids those membrane-bursting pressures.
CMP waste with lower TDS but abrasive solids usually favors RO-MVR when vibratory shear enhanced processing (VSEP) or equal pretreatment is in place. EDR plus a crystallizer fits high-silica backgrind water because EDR resists silica scale better than pressure membranes. According to real-world ZLD system performance data for HF wastewater, a 150 m³/h FO-NF-MVR train at a Tier-1 foundry held 92% recovery with effluent fluoride below 5 mg/L.
Parallel reading on chip fab wastewater ZLD hybrid system design helps compare campus-wide layouts. Chromium-bearing rinses should stay on a dedicated line such as chip fab chromium wastewater treatment with ZLD costs. Mixing Cr6+ into the fluoride precipitator only complicates sludge classification.
| Design Architecture | Best Application | Recovery Rate | CAPEX (150 m³/h) |
|---|---|---|---|
| FO-NF-MVR | HF Waste, High-TDS Brine | 90–95% | $8M–$12M |
| RO-MVR | CMP Waste, Low-TDS | 85–90% | $5M–$8M |
| EDR-Crystallizer | High-Silica Backgrind | 80–85% | $6M–$10M |
What CAPEX Applies to 300 mm Wafer Fab Equipment Water Islands?
CAPEX for a 150 m³/h FO-NF-MVR system still ranges from $8M to $12M, with equipment about 40% of total spend. Installation is roughly 30%. Engineering plus Scada integration is about 20%. A 300 mm fab rarely buys process-tool CAPEX and the water island as one SKU; the water island scales with m³/h of concentrated brine.
OPEX typically runs $0.80–$2.50 per m³ treated. Energy is about 50% of OPEX. Chemicals are about 20% for antiscalants and pH control. For a detailed cost breakdown for semiconductor wastewater treatment, FO/NF replacement every 3–5 years adds about $0.15/m³ to lifecycle cost. Recovered distillate reduces UPW make-up load and avoids discharge fees.
| Cost Category | Percentage of Total | Estimated Cost (150 m³/h) | Key Variables |
|---|---|---|---|
| Equipment (CAPEX) | 40% | $3.2M–$4.8M | MVR material (Titanium vs SS) |
| Energy (OPEX) | 50% | $0.40–$1.25/m³ | Local grid pricing ($/kWh) |
| Chemicals (OPEX) | 20% | $0.16–$0.50/m³ | Antiscalant dosing rates |
| Maintenance | 15% | $0.12–$0.37/m³ | Membrane life & CIP frequency |
What O&M factors matter for ZLD membranes and equipment?
ZLD membrane and O&M performance hinges on silica control, CIP discipline, and local power price. Operators should hold MVR feed pH near 6.0–7.0 with PLC-controlled chemical dosing for pH adjustment and antiscalant addition. That keeps silica soluble and limits CaSO4 scale. When heat-transfer coefficients fall by up to 30%, check evaporator tube scale first.
Developer azoles and surfactants foul FO/NF. CIP with 0.1% NaOH for organics then 0.5% citric acid for inorganics usually restores flux. Crystallizer blockages rise when crystals exceed about 500 µm. A hydrocyclone upstream keeps slurry density stable. Two-stage MVR compression can cut energy about 20% by lowering temperature lift when single-stage compressors foul.
"In ZLD operations, the difference between a 3-year and a 7-year ROI often comes down to the precision of the pretreatment stage. If you don't remove the silica and TSS before the MVR, your maintenance costs will cannibalize your water savings." — Senior Process Engineer, HydropureWater.
Who This Is For and Next Step
Fab utilities engineers, EPC process leads, and procurement managers use this page when sizing hybrid ZLD for HF, CMP, and high-TDS brine. Teams chasing only sanitary package plants, or sites without fluoride and high-TDS drivers, should look elsewhere. When you need a duty-spec’d 150 m³/h module or campus expansion package, request a technical quote with flow, fluoride, silica, and TDS data.
Frequently Asked Questions

What is the typical water recovery rate for a fab ZLD system?
A hybrid FO-NF-MVR configuration typically recovers 92–97% of the feed as distillate or permeate under design TDS. The remaining 3–8% leaves as salt cake or concentrated slurry from the crystallizer. Recovery falls when silica and calcium force lower flux or more frequent CIP. Engineers should size on the worst-case brine TDS of 50,000–150,000 mg/L, not on average campus flow alone.
How does ZLD help fabs meet fluoride discharge limits?
ZLD captures fluoride as precipitated CaF2 solids and membrane reject rather than releasing it to surface water. Chemical precipitation plus FO/NF concentration keeps liquid effluent at or below targets such as the EU’s 1.5 mg/L fluoride practice when the solids train is online. Because liquid discharge approaches zero, fabs can satisfy China SEPA Table 3 new-fab fluoride limits near 10 mg/L and tighter corporate caps below 5 mg/L.
What is the average OPEX for MVR-based semiconductor wastewater treatment?
MVR-based treatment OPEX usually sits between $0.80 and $2.50 per m³ of water processed. Electricity dominates, followed by antiscalant, pH chemicals, membrane CIP, and labor. In high-tariff grids such as Germany or parts of California, expect the upper end of that band unless two-stage compression and strong pretreatment cut fouling and temperature lift.
Can ZLD systems handle PFAS in semiconductor wastewater?
FO or RO stages reject most PFAS into the concentrate, and MVR plus crystallization further bind those compounds into solids for controlled disposal or incineration. ZLD does not destroy PFAS by itself; it prevents aqueous leakage when solids handling follows site hazardous-waste rules. Pair membrane rejection with a defined solids pathway before claiming compliance with the 4 ppt PFOA/PFOS MCL context.
How should O&M budgets cover FO and NF membrane life?
FO and NF elements in these trains are commonly replaced every 3–5 years, adding about $0.15/m³ to lifecycle cost when CIP and silica control are competent. Budget CIP chemicals, downtime, and spare modules in year-one O&M, not only power. Plants that skip pretreatment pay that membrane line item several times over through forced replacements and MVR derates.