Hybrid MBR DAF organic wastewater treatment design pairs dissolved air flotation with membrane biology so food, textile, and pharma plants clear high COD and FOG loads. DAF strips 60–80% of solids and grease first; the MBR then removes 90–95% of dissolved COD and BOD.
Why Organic Wastewater Treatment Fails in Industrial Plants
Organic wastewater treatment fails on industrial loads when solids and FOG reach the biology untreated. A hybrid train removes 60–80% TSS/FOG in DAF within 15–30 minutes at 4–10 m/h, then cuts 90–95% COD/BOD in MBR at 0.5–1.5 m³/m²·h. Food plants at 3,000–5,000 mg/L COD reach 95–98% overall COD removal under those conditions.
A food processing plant in Peru faced effluent above 3,000 mg/L Chemical Oxygen Demand (COD) and 500 mg/L Total Suspended Solids (TSS). Annual fines reached $200,000 under DPE 2020 discharge limits. That pattern repeats wherever high-strength organics meet undersized biology.
Conventional activated sludge often fails through bulking sludge, poor settling, and faster membrane fouling in Membrane Bioreactor (MBR) trains. Energy use climbs to 1.5–2.0 kWh/m³. Membrane replacements of $20,000–$50,000 per year follow when FOG never leaves the aeration tank.
Reuse targets near COD below 50 mg/L stay out of reach under those fouling loads. Food and beverage, pulp and paper, and petrochemical streams overwhelm methods sized for domestic sewage. Shock loads, pH swings, high temperature, and inhibitory compounds then push plants into chronic non-compliance.
Cheaper short-term builds without solids and FOG capture usually cost more through fines, downtime, and early membrane swaps. An industrial waste water discharge requirements review should sit beside any process choice. Permit math changes the ranking faster than equipment pricing does.
Plants comparing Oceania permit paths also read our Industrial Wastewater Treatment in Sydney: 2026 Compliance Guide with Costs, Equipment & Sydney Water Standards for New South Wales framing. New Zealand teams start with the Industrial Waste Water Management in Auckland: 2026 Specs guide. Both walk through local discharge limits before any hardware choice.
Hybrid MBR DAF Organic Wastewater Treatment Design: Process Flow
Hybrid MBR DAF organic wastewater treatment design puts physical-chemical separation ahead of membrane biology: Dissolved Air Flotation (DAF) first, DF Series MBR modules second, ClO₂ disinfection last. DAF targets suspended solids and Fats, Oils, and Grease (FOG). It typically removes 60–80% TSS and FOG with 30–50 μm microbubbles that lift flocculated colloids for skimming.
After DAF, the MBR degrades dissolved organics and typically delivers 90–95% COD and Biochemical Oxygen Demand (BOD) reduction. Membranes retain suspended solids and biomass, so effluent quality stays tight even when influent swings. Disinfection with an on-site Chlorine Dioxide (ClO₂) generator targets a 99.99% pathogen kill rate.
ClO₂ works across a wide pH band and forms fewer chlorinated byproducts than free chlorine in many reuse schemes. Hydraulic loading is set at 4–10 m/h for DAF and 0.5–1.5 m³/m²·h for MBR. Retention time is 15–30 minutes for DAF and 6–12 hours for MBR.
Tank geometry sets the DAF clock. Wikipedia's dissolved air flotation reference notes that rectangular units require 20 to 30 minutes of retention while circular units require just 3 minutes, which brackets the 15–30 minute design window used here. Most industrial retrofit sites we work with pick rectangular tanks when footprint allows the longer separation path.
Cutting solids and FOG upstream slows membrane fouling versus biology-only trains. Most plants we size for food or textile duty run at the lower end of that MBR flux window after a stable DAF stage. That choice cuts backwash and chemical clean frequency before membranes age out early.
| Process Stage | Equipment Series | Primary Function | Typical Removal Efficiency | Hydraulic Loading Rate | Retention Time |
|---|---|---|---|---|---|
| Pre-treatment | DAF | TSS, FOG, Suspended Organics Removal | 60–80% TSS/FOG | 4–10 m/h | 15–30 min |
| Biological Treatment | DF Series MBR | COD, BOD Degradation | 90–95% COD/BOD | 0.5–1.5 m³/m²·h | 6–12 h |
| Disinfection | ClO₂ Generator | Pathogen Inactivation | 99.99% Kill Rate | N/A | N/A |
Influent first passes screening, then DAF for solids and FOG separation. Clarified water enters equalization to buffer flow and concentration swings before the MBR. Equalization smooths batch dumps so aeration and permeate pumps stay stable through shift changes. Post-MBR effluent is disinfected with chlorine dioxide before discharge or reuse.
The DAF float layer also cuts sludge that would otherwise load downstream dewatering. Footprint stays smaller than multi-stage conventional trains with separate clarifiers. Equipment references include a high-efficiency DAF system for TSS and FOG removal and an on-site ClO₂ generator for pathogen removal and disinfection.
On the biological side, an MBR system for COD and BOD removal in industrial effluents carries the membrane stage. Single-atom catalyst plus H₂O₂ oxidation remains an option for refractory organics after biology, not a replacement for DAF solids capture. Keep oxidation for polish streams that still miss COD after the membrane stage, spending oxidant only on the hard fraction.
Metal-organic frameworks appear in dye-adsorption research, yet plant buyers still start with DAF coagulants for textile color when TSS is the immediate membrane risk. Research chemistry rarely survives a weekend shift unchanged.
How Do You Handle Industrial Organic Wastewater MBR Fouling Control?
Fouling control starts upstream of the membranes. Wikipedia's membrane bioreactor reference calls fouling "the most serious problem affecting system performance" and lists four mechanisms: pore blocking, standard blocking, intermediate blocking, and cake formation. DAF protection attacks the feed side of all four by stripping solids and FOG early.
The cleaning ladder then runs on a fixed calendar. The same reference schedules chemically enhanced backwash daily, maintenance cleaning with higher chemical concentration weekly, and intensive chemical cleaning once or twice a year, with sodium hypochlorite and citric acid as the prevalent agents. Write that cadence into the OPEX model before quoting membrane life.
Carryover discipline matters most. Keep DAF float solids below 30–50 mg/L TSS at the MBR feed, confirm scour air in Nm³/m²·h against the datasheet, and log transmembrane pressure on a fixed schedule. Fouling that survives that regime usually traces to a coagulant dosing error, not the membrane.
Coagulant dose discipline closes the loop. Jar-test the DAF polymer on FOG-heavy food streams when recipes change seasonally, because fat content swings move float quality more than any equipment setting. A stable float keeps the 30–50 mg/L carryover contract honest.
What MBR DAF Removal Efficiency Can Food, Textile, and Pharmaceutical Plants Expect?
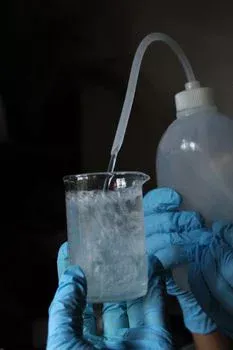
Hybrid MBR-DAF trains for food processing typically cut influent COD of 3,000–5,000 mg/L and TSS of 500–1,000 mg/L. Effluent COD of 50–150 mg/L and TSS below 30 mg/L are common under stable operation. That equates to about 95–98% COD removal when both stages stay in design windows. Many direct-discharge permits still sit near COD below 100 mg/L.
That COD band is the decision gate for reuse versus sewer discharge. Pharmaceutical wastewater with COD of 10,000–50,000 mg/L and refractory organics such as antibiotics often needs advanced oxidation after biology. The target is effluent COD below 50 mg/L with greater than 98% COD removal when AOP is included.
Textile streams at COD 500–2,000 mg/L gain from DAF plus coagulants for greater than 90% color removal before membrane polishing. Chemical plants at COD 1,000–10,000 mg/L usually land below 100 mg/L COD and below 20 mg/L TSS on a tuned hybrid train. TSS removal above 90% is the normal membrane-protected outcome across these sectors.
Independent references bracket these numbers. Wikipedia's membrane bioreactor article states that COD "removal can be increased to 96 to 99 percent in membrane bioreactors" versus about 95 percent in conventional activated sludge, which matches the band in the table below. The hybrid window assumes FOG has already left the stream in the DAF float.
Nutrient removal for total nitrogen and phosphorus still varies widely. Nitrification/denitrification zones or chemical phosphorus precipitation close the gap when the permit is tight. Table values below are engineering benchmarks from EPA-style category ranges and HydropureWater product windows, not a site permit.
| Industry | Influent COD (mg/L) | Effluent COD (mg/L) | COD Removal (%) | Influent TSS (mg/L) | Effluent TSS (mg/L) | TSS Removal (%) | BOD Removal (%) | TN Removal (%) | TP Removal (%) |
|---|---|---|---|---|---|---|---|---|---|
| Food Processing | 3,000–5,000 | 50–150 | 95–98 | 500–1,000 | <30 | >95 | >95 | 30–60 | 20–50 |
| Pharmaceutical | 10,000–50,000 | <50 (with AOP) | >98 (with AOP) | 200–800 | <10 | >90 | >90 | 40–70 | 30–60 |
| Textile | 500–2,000 | <100 | 90–95 | 300–900 | <25 | >90 | >90 | 20–50 | 10–40 |
| Chemical | 1,000–10,000 | <100 | 90–98 | 100–500 | <20 | >90 | >90 | 30–70 | 20–50 |
What Are Food Processing Wastewater Reuse COD Limits?
Food processing wastewater reuse COD limits typically start below 100 mg/L for direct discharge and tighten toward 50 mg/L or lower for in-plant reuse. Effluent COD of 50–150 mg/L from the hybrid train meets most sewer and surface-water permits at the lower end of that band. Reuse loops feeding first-rinse or wash-down duty usually add polishing beyond the MBR permeate.
The reuse decision is economic as much as regulatory. The 100 m³/h case below recovers $150,000 per year through non-potable reuse, which is what pushes plants from discharge to reuse. Disinfection to the 99.99% kill rate with ClO₂ then becomes the final compliance step, not an option.
How Much Does a 50 m³/h Hybrid Organic System Cost?
A 50 m³/h hybrid MBR-DAF package carries 2025 industry CAPEX models of $600,000–$900,000. OPEX sits near $0.50–$0.70 per cubic meter under typical food or light chemical duty. MBR modules drive 40–50% of CAPEX; DAF takes 20–30%, disinfection 10–15%, and civil works 15–20% for tanks, foundations, and piping.
Energy usually takes 40–50% of OPEX for aeration and transfer pumps. Chemical dosing for coagulation, flocculation, and disinfection adds 20–30%. Labor runs 10–15%, and membrane replacement 10–20% even with good pre-treatment.
DAF pre-treatment can cut MBR energy by about 0.3 kWh/m³ through lower solids load. It can also trim maintenance cost 20–30% by slowing fouling and cleaning cycles. Lower sludge mass to dewatering further reduces polymer and haul tickets on FOG-heavy sites.
A 100 m³/h train at about $1 million CAPEX that avoids $200,000 per year in fines and recovers $150,000 per year through non-potable reuse can show a 3–5 year payback when those credits hold. Smaller 10 m³/h skids model at $150,000–$250,000 CAPEX with OPEX near $0.60–$0.80/m³. Larger 200 m³/h plants model at $1,800,000–$2,500,000 CAPEX with OPEX near $0.40–$0.60/m³ as fixed labor dilutes.
Site power tariff, sludge haul distance, and membrane brand still move the band more than brochure averages suggest. For city-scale CAPEX patterns, compare the Bhopal wastewater treatment plant cost 2026 and Phoenix wastewater treatment plant cost 2025 breakdowns before locking a budget class. Automation that trims chemical overdosing often pays back faster than upsizing membrane area on FOG-heavy plants.
| System Capacity (m³/h) | Estimated CAPEX ($) | Estimated OPEX ($/m³) | Key Cost Drivers (CAPEX/OPEX) |
|---|---|---|---|
| 10 | 150,000–250,000 | 0.60–0.80 | MBR Membranes, Energy, Chemicals |
| 50 | 600,000–900,000 | 0.50–0.70 | DAF System, MBR Modules, Energy, Membrane Replacement |
| 100 | 1,000,000–1,500,000 | 0.45–0.65 | Civil Works, MBR Modules, Energy, Chemical Dosing |
| 200 | 1,800,000–2,500,000 | 0.40–0.60 | Energy Consumption, Membrane Lifespan, Automation |
What Are Typical Toray MBR Specs for Industrial Duty?
Typical Toray MBR specs are OEM datasheet values for flux, packing density, and scour air, not a single plant-wide number. Buyers should map those module ratings to the hydraulic window used here for DF Series MBR duty. That window is 0.5–1.5 m³/m²·h permeate loading with 6–12 h HRT after DAF has already removed 60–80% TSS/FOG.
When Toray flat-sheet or hollow-fiber modules sit in a hybrid train, design against the food-industry effluent targets above. Use COD 50–150 mg/L and TSS below 30 mg/L as the control points. Do not size membranes against untreated influent COD of 3,000–5,000 mg/L — the upstream DAF cut is what keeps scour energy and chemical cleans inside the OPEX band of $0.50–$0.70/m³ at 50 m³/h.
Use this selection checklist when comparing module brands on the same flowsheet. Confirm net flux at 20 °C design temperature and packing density versus available tank volume. Verify scour air in Nm³/m²·h, the CIP chemical set with interval, and warranty hours at stated TMP.
Also check spare-element lead time and compatibility with upstream DAF float solids carryover below 30–50 mg/L TSS. An MBR Membrane Bioreactor Wastewater Treatment System package should publish those same fields so OEM curves compare side by side. Spec sheets without scour air and CIP interval are incomplete for FOG service.
Compliance and Discharge Limits for Hybrid MBR-DAF Plants
Hybrid MBR-DAF plants must meet the specific permit on the discharge point, not a generic brochure limit. US EPA effluent limitations guidelines under the Clean Water Act set category-specific caps for COD, BOD, TSS, nutrients, and toxics. EU Urban Waste Water Treatment and Industrial Emissions rules add another layer, and local utilities often write tighter numbers into the site permit than national defaults.
The Peru DPE 2020 case shows how regional caps turn into cash risk when COD stays above 3,000 mg/L without adequate solids and FOG removal. DAF lowers the solids and organic load so the MBR can hold COD and BOD. Membrane filtration then holds TSS, often below 10 mg/L on well-tuned trains. ClO₂ disinfection addresses microbial limits for reuse or sensitive receiving waters.
Where nitrogen or phosphorus caps are tight, add biological nutrient removal or chemical precipitation after the core MBR-DAF steps. Continuous online COD/TSS monitoring and documented cleaning cycles keep the train inside permit during weekend dumps. Wastewater characterization and a draft permit review should precede equipment selection, not follow it.
For metals-heavy streams, keep organic COD polishing and metals precipitation on separate decision trees unless the influent truly needs both. Cross-check process claims against EPA 2024 heavy-metal precipitation benchmarks before mixing precipitation chemistry into an organic-focused flowsheet. Metals chemistry carries its own sludge and pH demands that a hybrid MBR-DAF train was never sized for.
Who This Is For, Who Should Look Elsewhere, and Next Step
This guide serves plant engineers, EPC leads, and procurement teams sizing food, textile, pharma, or chemical trains in the 10–200 m³/h band. The focus is DAF-protected MBR performance with a clear CAPEX/OPEX band. Look elsewhere if the duty is domestic sewage only, or if the main driver is metals precipitation rather than high FOG and COD.
To size a hybrid train against your COD/TSS profile and reuse target, send the influent sheet through our request-quote form with flow, peak factor, and permit limits. A same-week budget band keeps the project moving while the permit review runs.
Frequently Asked Questions
What removal rate should a hybrid MBR-DAF reach on food wastewater?
Food plants with influent COD of 3,000–5,000 mg/L and TSS of 500–1,000 mg/L typically reach 95–98% COD removal and TSS below 30 mg/L when DAF removes 60–80% TSS/FOG ahead of the MBR. Effluent COD of 50–150 mg/L is the common design band for direct discharge or non-potable reuse. Hold both stages inside their design windows and the numbers repeat week after week.
Why put DAF ahead of an MBR on high-FOG streams?
DAF at 4–10 m/h with 15–30 minute retention strips FOG and solids that would otherwise foul membranes and raise aeration demand. That cut can reduce MBR energy by about 0.3 kWh/m³ and lower maintenance cost 20–30% versus biology-only layouts. Most high-FOG food plants we size run DAF first for exactly that reason.
What CAPEX should I budget for a 50 m³/h hybrid system?
Industry 2025 models place a 50 m³/h hybrid MBR-DAF package at $600,000–$900,000 CAPEX with OPEX of $0.50–$0.70/m³. MBR modules take 40–50% of CAPEX, and energy takes 40–50% of OPEX. Final price still tracks civil scope, membrane brand, and local power tariff, so hold a contingency band rather than a point estimate.
Can hybrid MBR-DAF meet zero-liquid-discharge goals alone?
Hybrid MBR-DAF can produce reuse-grade water with low COD and TSS, which shrinks the volume sent to evaporators or crystallizers in a zero-discharge scheme. Full zero liquid discharge still needs concentration and solids handling beyond disinfection. Treat MBR-DAF as the polishing front end of the ZLD block, not the entire block.
How do Toray MBR modules fit this hybrid design window?
Map Toray datasheet flux and scour rates to 0.5–1.5 m³/m²·h loading and 6–12 h HRT after DAF, then confirm the CIP interval against your FOG and TSS carryover. Do not size modules on raw 3,000–5,000 mg/L COD when DAF already removes 60–80% TSS/FOG upstream. OEM curves beat brochure averages for warranty talk.