Wastewater Treatment Plant Cost in Nairobi: 2025 CAPEX/OPEX Breakdown, Tech Selection & Zero-Risk Compliance
In Nairobi, a 30 m³/day wastewater treatment plant for a pharmaceutical facility costs $120K–$250K (CAPEX), with monthly OPEX of $1,500–$3,000 ($0.15–$0.30/m³). For larger industrial plants (1,000 m³/day), CAPEX ranges from $1.2M (activated sludge) to $2.5M (MBR), while municipal-scale plants (1 MGD) start at $6M. NEMA compliance adds 15–25% to CAPEX but avoids fines up to KES 1M or forced closure. Local factors—import duties (25% on equipment), labor costs (KES 3,000/day for skilled technicians), and power reliability—can swing OPEX by ±30%.Why Nairobi’s Wastewater Crisis Demands a Zero-Risk Solution
Nairobi’s sewerage system covers only 40% of the city, leaving 4.5M people and 60% of industrial zones unsewered (Nairobi City Water and Sewerage Company 2024 data). This significant infrastructure gap forces a majority of residential, commercial, and industrial developments in fast-growing areas to implement private wastewater treatment solutions to meet regulatory demands. NEMA’s 2025 enforcement blitz specifically targets unsewered areas, with 127 businesses fined KES 500K–1M in 2024 for non-compliance (NEMA Annual Report 2024). The cost of inaction—fines, reputational damage, and potential forced closure—far outweighs the initial capital investment in a compliant system. For instance, a 50 m³/day textile plant in Mlolongo avoided KES 800K in NEMA fines by installing a $220K Dissolved Air Flotation (DAF) and Anoxic/Oxic (A/O) system. This investment achieved payback in just 18 months, primarily through reduced water costs from treated effluent reuse, demonstrating the tangible benefits beyond compliance. Nairobi’s growth corridors, including Ruiru, Kitengela, and Athi River, are expanding rapidly, but municipal infrastructure struggles to keep pace. This makes purpose-built private wastewater treatment plants the only viable and legal option for new developments and existing facilities seeking to ensure environmental compliance and sustainable operations.Wastewater Treatment Plant Costs in Nairobi: CAPEX Breakdown by Technology
The following table provides a detailed CAPEX breakdown for common wastewater treatment technologies across various capacities in Nairobi:
| Technology Type | Capacity (30 m³/day) | Capacity (500 m³/day) | Capacity (1 MGD / 3,785 m³/day) | Key Local Cost Drivers |
|---|---|---|---|---|
| Activated Sludge (Conventional) | $120K – $180K | $900K – $1.4M | $6M – $9M | Lowest CAPEX, but large footprint requires more land (KES 12M/acre in Roysambu). Civil works: KES 15,000/m² in Nairobi. |
| Membrane Bioreactor (MBR) | $200K – $250K | $1.5M – $2.5M | $9M – $15M | 20–30% higher CAPEX than activated sludge, but reduces footprint by 60%, crucial for land-constrained areas. MBR systems deliver superior effluent quality. |
| Dissolved Air Flotation (DAF) + Biological | $180K – $220K | $1.2M – $1.8M | $7M – $11M | DAF systems add $50K–$200K to CAPEX but significantly reduce downstream biological load. Ideal for high-FOG wastewater from food processing plants in Syokimau. DAF systems for Nairobi’s high-FOG industrial wastewater are highly effective. |
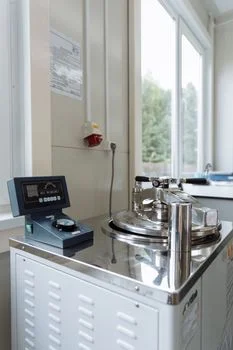
| Underground WSZ Series Plants | $80K – $150K | $400K – $600K (for equivalent flow rate) | N/A (typically smaller scale) | Underground WSZ series plants for Nairobi’s residential zones (1–80 m³/h) cost $80K–$600K (CAPEX) and avoid NEMA’s ‘no visible infrastructure’ restrictions in residential zones like Ruaraka. |
| Reverse Osmosis (RO) (for Reuse) | Add $80K – $120K to base system | Add $500K – $800K to base system | Add $3M – $5M to base system | RO systems for reuse-quality effluent can double CAPEX but enable 70% water recycling, reducing water bills by 40% for industries like textiles and pharmaceuticals. |
OPEX in Nairobi: Power, Labor, Chemicals, and Hidden Costs
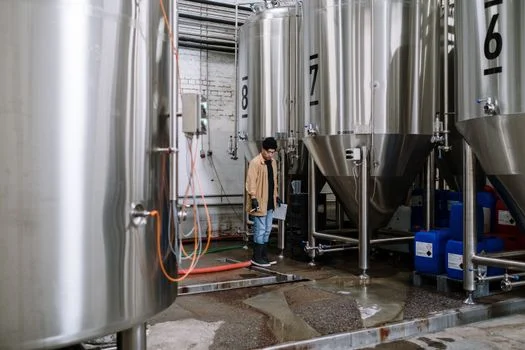
Operational expenditure (OPEX) for wastewater treatment plants in Nairobi can range from $0.15–$0.40/m³, with power, labor, and chemical costs forming the largest components, often fluctuating by ±30% due to local market dynamics. Power costs are a significant driver, with electricity priced at approximately KES 25/kWh in Nairobi, notably higher than KES 18/kWh in Mombasa. Aeration, a fundamental process in many biological systems, accounts for up to 60% of the total OPEX in activated sludge systems (per Biozone 2024 data), making energy efficiency a critical design consideration. Labor costs in Nairobi are also a substantial factor. Skilled technicians command KES 3,000–5,000 per day. NEMA regulations mandate 24/7 monitoring for plants exceeding 500 m³/day, which can increase overall labor costs by an additional 30%. Chemical expenditures, particularly for coagulants and flocculants, are impacted by import duties of 25% and potential shipping delays, driving prices up by as much as 40% compared to international benchmarks (e.g., KES 1,200/kg for PAC in Nairobi versus KES 850/kg in South Africa). Efficient automatic chemical dosing systems can help optimize usage and reduce waste. Maintenance costs, though often underestimated, are crucial. MBR membranes, for example, typically last 5–7 years in Nairobi, a shorter lifespan compared to 8–10 years in Europe. This discrepancy is largely attributed to power fluctuations and higher total suspended solids (TSS) in influent wastewater, which can lead to increased fouling and wear (per Zhongsheng field data). Regular maintenance, including the use of reliable equipment like plate and frame filter presses for sludge dewatering, is essential for extending equipment life. Beyond these direct costs, hidden operational expenses include annual NEMA inspection fees (approximately KES 50K/year), sludge disposal costs (around KES 2,500/ton at facilities like Dandora landfill), and the critical investment in power backup systems, such as a 50 kVA generator, which can cost up to KES 1.5M, to ensure continuous operation amidst frequent power outages.Tech Comparison: MBR vs. DAF vs. Activated Sludge for Nairobi’s Wastewater
The following table provides a side-by-side comparison of MBR, DAF, and Activated Sludge technologies:
| Criteria | MBR (Membrane Bioreactor) | DAF (Dissolved Air Flotation) | Activated Sludge (Conventional) |
|---|---|---|---|
| CAPEX | High ($200K–$2.5M for 30–1000 m³/day) | Medium-High ($180K–$1.8M for 30–1000 m³/day) | Low-Medium ($120K–$1.4M for 30–1000 m³/day) |
| OPEX | Medium ($0.25–$0.40/m³) | Medium ($0.20–$0.35/m³) | High ($0.30–$0.50/m³) |
| Footprint | Very Small (60% smaller than activated sludge) | Small (compact primary treatment) | Very Large (requires significant land) |
| Effluent Quality (BOD/COD/TSS) | Excellent (BOD <10, COD <50, TSS <5 mg/L) | Good (TSS, FOG removal >90%) | Good (BOD <30, TSS <30 mg/L) |
| NEMA Compliance | Meets reuse standards (COD ≤50 mg/L) | Requires post-treatment for full BOD/COD compliance | Meets basic secondary standards, often needs tertiary for COD/fecal |
| Sludge Production | Low (high sludge age) | Medium (concentrated float sludge) | High (bulky sludge, high disposal costs) |
| Power Consumption | Medium (aeration + membrane scour) | Medium (pump, compressor) | High (aeration for large tanks) |
| Scalability | Good (modular membrane units) | Good (parallel units) | Good (additional tanks) |
NEMA Compliance: How Much Extra CAPEX Buys Zero-Risk Discharge
Achieving NEMA’s stringent 2025 effluent standards often necessitates an additional 15–40% CAPEX investment in tertiary treatment and automation, directly mitigating risks of KES 500K–1M fines and operational closures. NEMA’s 2025 effluent standards are clear: BOD ≤30 mg/L, COD ≤50 mg/L, TSS ≤30 mg/L, pH 6–9, and fecal coliform ≤1,000 CFU/100mL (NEMA 2024). While secondary treatment technologies like activated sludge can meet BOD and TSS limits, they frequently fall short on COD and fecal coliform requirements, particularly for industrial discharges or reuse applications. To consistently achieve these higher standards, particularly for COD and fecal coliform, facilities must invest in tertiary treatment. This often involves integrating advanced processes like DAF followed by Reverse Osmosis (RO) water purification or MBR systems, which can increase CAPEX by up to 40%. Disinfection, often achieved with chlorine dioxide generators, is also crucial for meeting fecal coliform limits. integrating automation—such as PLC-controlled dosing systems and remote monitoring—adds approximately 15% to CAPEX but can reduce NEMA violations by as much as 80% by ensuring consistent process control and real-time data for compliance reporting (per Biozone 2024 compliance data). A compelling example is a 100 m³/day pharmaceutical plant in Ruaraka that invested $180K in a DAF + MBR system specifically to meet NEMA’s strict COD limits. This proactive investment prevented KES 1.2M in potential fines and a costly 30-day operational closure. For a 500 m³/day industrial plant, an additional $400K CAPEX for tertiary treatment can yield a payback period of just 2.5 years through a combination of avoided NEMA fines (estimated at KES 500K/year) and significant water reuse savings (estimated at KES 1.8M/year), underscoring the strong return on investment for compliance-driven upgrades. For cost benchmarks for African markets with similar regulatory challenges, explore wastewater treatment plant cost in Senegal.Zero-Risk Procurement: A 5-Step Decision Framework for Nairobi Buyers
- Step 1: Define Effluent Requirements and Influent Characteristics. Clearly outline your discharge goals (e.g., NEMA limits, water reuse quality) and thoroughly characterize your influent wastewater (flow rate, TSS, COD, BOD, FOG, pH). This data forms the bedrock for accurate technology selection and system design.
- Step 2: Shortlist Technology Options. Utilize detailed comparison tables, like the one provided earlier, to identify technologies best suited for your specific influent and effluent targets. For example, MBR systems are ideal for reuse, while DAF excels with high-FOG wastewater.
- Step 3: Request Granular CAPEX/OPEX Quotes from Multiple Vendors. Obtain comprehensive quotes that itemize costs for local civil works, imported equipment (including import duties), installation labor, commissioning, and a detailed breakdown of projected OPEX (power, chemicals, labor, maintenance). Compare local vs. imported equipment options.
- Step 4: Validate Vendor NEMA Compliance and Local Expertise. Request at least three Nairobi-specific references from each vendor, along with their NEMA certifications and verifiable effluent test reports from existing installations. Assess their track record in meeting Kenyan regulatory standards. Understanding how to evaluate equipment suppliers for emerging markets can be beneficial.
- Step 5: Negotiate Performance Guarantees and Local Support. Secure contractual performance guarantees for effluent quality, system uptime, and anticipated sludge production. Crucially, ensure robust local support, including 24/7 technician availability in Nairobi, spare parts inventory, and warranty terms that account for local operating conditions.
A vendor scorecard template can help objectively evaluate potential suppliers:
| Criteria | Weight (%) | Score (1-5) | Weighted Score |
|---|---|---|---|
| NEMA Certification & Compliance Track Record | 30% | ||
| Local Office & Support Team in Nairobi | 20% | ||
| Technology Suitability & Efficiency | 15% | ||
| CAPEX Competitiveness | 10% | ||
| OPEX Projections & Guarantees | 10% | ||
| Warranty & After-Sales Service | 5% | ||
| Spare Parts Availability (Local Stock) | 5% | ||
| References (Nairobi-based) | 5% | ||
| Total Score | 100% |
Frequently Asked Questions
Procurement managers and facility engineers in Nairobi frequently inquire about the specific costs, regulatory implications, and implementation timelines for wastewater treatment plants to inform their investment decisions.Q: How much does a 100 m³/day wastewater treatment plant cost in Nairobi?
A: For a 100 m³/day industrial or commercial facility in Nairobi, CAPEX typically ranges from $350K–$600K for an activated sludge system augmented with DAF for pre-treatment, or $500K–$800K for a more compact and higher-quality MBR system. Monthly OPEX can be estimated at $0.20–$0.40/m³. Achieving full NEMA compliance often adds an additional 20–30% to the initial CAPEX.
Q: What are the NEMA fines for non-compliance in Nairobi?
A: NEMA fines for wastewater non-compliance in Nairobi typically range from KES 500K–1M per violation. Beyond monetary penalties, NEMA has the authority to issue forced closure orders, requiring facilities to cease operations until full compliance is achieved. Repeat offenders face escalated penalties, including potential criminal charges.
Q: Can I use an underground plant in a residential area in Nairobi?
A: Yes, underground wastewater treatment plants are specifically designed for discreet installation in residential or aesthetically sensitive areas. WSZ series underground plants (1–80 m³/h) meet NEMA’s ‘no visible infrastructure’ guidelines and typically cost between $80K–$600K in CAPEX, depending on capacity and specific features.
Q: How long does it take to install a wastewater treatment plant in Nairobi?
A: The installation timeline for a wastewater treatment plant in Nairobi varies. For systems largely relying on imported equipment from regions like China or the EU, the process can take 8–12 weeks, factoring in shipping and customs. Locally assembled systems, such as those provided by Zhongsheng Environmental, can often be installed within 4–6 weeks. Additionally, obtaining NEMA approval for the plant design and environmental impact assessment typically adds another 30–60 days to the overall project timeline.
Q: What’s the payback period for a wastewater treatment plant in Nairobi?
A: The payback period for a wastewater treatment plant in Nairobi generally ranges from 2–4 years for industrial facilities. This rapid return on investment is driven by significant savings from avoided NEMA fines and substantial reductions in water utility bills through effluent reuse. For municipal or large-scale commercial plants, the payback period can extend to 5–7 years, primarily through reduced sludge disposal costs and long-term operational efficiency.