The best water purification system for industrial use depends on influent quality, discharge limits, and budget. Applying cost models purification risk selection specs early prevents underspecification and hidden OPEX. Reverse osmosis (RO) can reach TDS <10 mg/L at about 95% recovery for pharma and semiconductor duty. Membrane bioreactors (MBRs) filter below 1 μm and cut footprint about 60% versus conventional trains. Dissolved air flotation (DAF) removes 92–97% of suspended solids and often precedes RO for reuse or zero-liquid discharge. CAPEX spans roughly $50K for small RO skids to $5M for large MBR plants, with energy often 0.5–2 kWh/m³ and membranes replaced every 3–5 years.
Cost Models Purification Risk Selection Specs: What Engineers Check First
The best industrial water purification system is the train that meets worst-case influent, permit limits, and total cost of ownership—not the lowest bid. RO targets dissolved ions; MBR targets organics and fine solids; DAF targets TSS and FOG; multi-media filtration protects downstream membranes. Selection hinges on measured variability, energy, and membrane life, not nominal flow alone.
Why Do Industrial Water Purification Systems Fail in the Field?
The underspecification trap still drives many failures. Teams often size on average flow and ignore influent swings. In one textile dyeing site, average COD was 200 mg/L, yet peaks hit 600 mg/L. A standard RO train fouled within six months. Cleaning moved from quarterly to weekly, and membrane life fell about 70%. Specs must use worst-case data, not averages.
The compliance gap is the second failure mode. A plant that met 2020 limits may miss 2026 phosphorus or microplastic rules. The EU Industrial Emissions Directive 2010/75/EU now tightens textile discharge limits many legacy aerobic systems cannot meet. Without a gap check, fines and forced outages follow.
Hidden OPEX is the third trap. A semiconductor plant cut about $200,000 per year by moving from clarified-water RO to compact MBR systems for high-efficiency filtration and reuse. Higher-quality permeate reduced polishing load and cut chemical use about 40%. That is the practical core of cost models purification risk selection specs on live sites.
| Contaminant | U.S. EPA (NPDES) Limit | EU (IED 2010/75/EU) Limit | Typical Industrial Influent |
|---|---|---|---|
| COD (Chemical Oxygen Demand) | <120 mg/L (varies by sector) | <100 mg/L | 500–5,000 mg/L |
| BOD (Biochemical Oxygen Demand) | <30 mg/L | <25 mg/L | 200–2,000 mg/L |
| TSS (Total Suspended Solids) | <30 mg/L | <35 mg/L | 100–1,000 mg/L |
| Total Phosphorus | <1.0 mg/L | <0.5 mg/L | 5–20 mg/L |
| Heavy Metals (Lead/Chrome) | <0.1 mg/L | <0.05 mg/L | 1–50 mg/L |
How Do RO, MBR, DAF, and Multi-Media Filtration Compare?
RO drives dissolved solids through semi-permeable membranes under pressure and can reach TDS <10 mg/L. It needs strict pretreatment, often Silt Density Index <5, to limit fouling. MBR pairs biology with membrane filtration, drops secondary clarifiers, and suits high-organic loads in a smaller footprint.
For primary solids and FOG duty, DAF systems for high-efficiency solids and FOG removal remain the workhorse. Pressurized air forms micro-bubbles that lift particles for skimming. DAF does not strip dissolved salts, so reuse trains usually add RO downstream.
| System Type | Primary Removal Target | Flow Range (m³/h) | Energy Use (kWh/m³) | CAPEX ($/m³/h) | Ideal Application |
|---|---|---|---|---|---|
| RO (Reverse Osmosis) | TDS, Ions, Viruses | 5 – 500+ | 0.5 – 2.0 | $1,500 – $3,500 | Electronics, Pharma, Boiler Feed |
| MBR (Membrane Bioreactor) | COD, BOD, TSS | 10 – 1,000+ | 0.8 – 1.5 | $2,000 – $4,500 | Food Processing, Textiles, Municipal |
| DAF (Dissolved Air Flotation) | TSS, FOG, Algae | 20 – 2,000+ | 0.1 – 0.3 | $800 – $1,800 | Slaughterhouses, Oil & Gas, Paper |
| Multi-Media Filtration | Large Solids (>20μm) | 10 – 5,000+ | 0.05 – 0.1 | $400 – $900 | RO Pretreatment, Cooling Towers |
RO is a red flag when COD stays above 500 mg/L because biofouling risk rises sharply. An MBR or DAF-RO hybrid is usually safer. Where volume is high and purity targets are modest, multi-media filters are a low-cost first barrier, though they cannot match membrane ionic or microbial purity.
How Does Advanced Water Purification Reduce Total Ownership Cost?
Ownership cost falls when pretreatment protects membranes and permeate quality cuts polishing chemicals. For a 100 m³/h RO train, CAPEX may sit near $300,000, yet five-year energy, chemicals, and membrane spend can exceed that purchase price. Matching stage duty to contaminant type is the cheapest lever.
Where plants also need point-of-use polished water for labs or amenities, a Commercial Direct Drinking Water System can sit downstream of industrial reuse without oversizing the main process train. Keep process and potable loops separate in design reviews.
What Engineering Specs Should You Demand Before Buying?
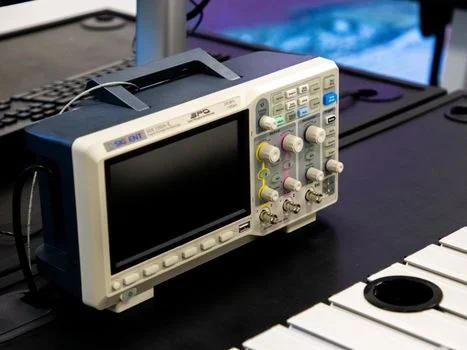
When reviewing a quote for high-recovery industrial RO systems for ultra-pure water, reject “standard condition” claims alone. Lab water at 25°C and neutral pH rarely matches factory feed. Ask for proven tolerances across your influent range.
Request these ten parameters from any vendor:
- Influent TDS Tolerance: RO should handle <2,000 mg/L for standard brackish units; MBR can tolerate <10,000 mg/L.
- Membrane Pore Size: Ensure RO is 0.0001 μm for ionic removal; MBR should be 0.03–0.1 μm for bacteria/solids.
- Flux Rate (LMH): Liters per square meter per hour. High flux rates (e.g., >25 LMH for RO) often lead to premature fouling.
- Recovery Rate: RO systems should target 75–95%; MBR typically achieves 90–98%.
- Energy Consumption: Verified kWh per cubic meter of permeate produced.
- Cleaning-in-Place (CIP) Frequency: Ask for the expected interval between acid/alkaline washes.
- Automation Level: Integration with SCADA/PLC for real-time transmembrane pressure (TMP) monitoring.
- Footprint Efficiency: Total square meters required per 100 m³/h of capacity.
- Membrane Material: PVDF is preferred for MBR due to chemical resistance; Polyamide Thin-Film Composite (TFC) for RO.
- Chemical Dosing Requirements: Antiscalants, coagulants, and pH adjusters needed per m³.
Verify claims with third-party lab reports or pilot data. Be wary of 99.9% DAF removal claims. Field oily wastewater often lands at 92–97% (EPA 2024 data). Higher figures usually come from controlled lab feeds that do not hold on the factory floor.
How Do You Estimate Energy Use and Operating Cost by System Type?
Shift budgeting from lowest bid to lowest total cost of ownership. CAPEX is only the start. For a 100 m³/h RO system, energy, chemicals, and membrane replacements over five years can surpass the initial outlay.
| Cost Category | RO System (100 m³/h) | MBR System (100 m³/h) | DAF System (100 m³/h) |
|---|---|---|---|
| CAPEX (Estimated) | $250,000 – $400,000 | $350,000 – $550,000 | $120,000 – $180,000 |
| Energy Cost ($/m³) | $0.08 – $0.25 | $0.12 – $0.30 | $0.02 – $0.05 |
| Chemical Cost ($/m³) | $0.03 – $0.08 | $0.02 – $0.05 | $0.05 – $0.15 |
| Membrane Replacement | $15,000 – $25,000/yr | $10,000 – $20,000/yr | N/A (Scraper blades) |
| Total OPEX ($/m³) | $0.25 – $0.50 | $0.30 – $0.60 | $0.10 – $0.25 |
Hidden costs include pretreatment. RO often needs multi-media and carbon filters, adding about 15–20% to CAPEX. MBR scouring blowers can consume about 20–30% of the energy bill. If water and sewer cost $2.50/m³ and a 100 m³/h RO saves $1.50/m³ net, payback often falls near 2.5 to 3 years.
How Should You Match Industry Duty to a Purification Train?
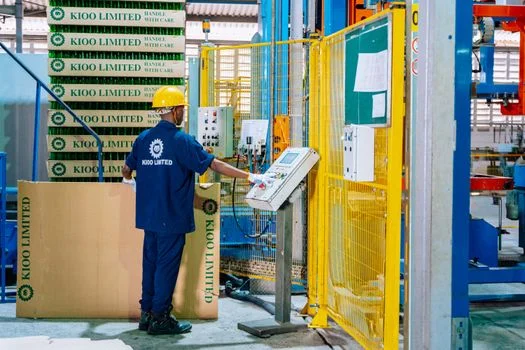
Match influent chemistry to each stage’s strength. High-salinity streams can exceed standard RO osmotic limits. In those cases, RO systems for high-salinity wastewater (TDS >10,000 mg/L) use higher pressure and specialized membranes to hold discharge compliance.
| Industry Sector | Primary Challenge | Recommended System Configuration |
|---|---|---|
| Food & Beverage | High Organics (COD/BOD) | DAF (Pretreatment) + MBR (Biological) + RO (Reuse) |
| Textile & Dyeing | Color, Salt, COD | DAF (Color) + MBR + RO (Salt Recovery) |
| Semiconductor | Ultra-pure water (UPW) | Multimedia + RO + Electrodeionization (EDI) |
| Pharmaceutical | Pyrogens, Bacteria | Double-pass RO + UV Sterilization + UF |
| Chemical/Mining | High Salinity/Metals | Chemical Precipitation + MVR evaporation for high-salinity wastewater |
Hybrid trains are common for zero-liquid discharge in 2026. A textile plant may use DAF to remove about 95% of suspended solids, MBR for organics, then an MVR evaporator for salt recovery and full recycle. Staging lowers single-point failure risk and supports regional compliance and cost benchmarks for industrial water treatment.
Which Emerging Options Matter for 2026–2030?
Vendors are pushing lower chemical use and lower energy. Three options are moving from pilot to full scale:
- Catalytic Ozonation: Catalysts raise ozone oxidation power and can exceed 99% COD removal on recalcitrant organics such as IPA without secondary sludge. Chemical plants often trial catalytic ozonation for COD removal as a polishing or pretreatment stage.
- AI-Driven Membrane Optimization: Algorithms can flag fouling about 48 hours ahead and trigger smart backwash. Reported gains include about 15% lower energy and longer membrane life.
- Hybrid RO-MVR Systems: High-pressure RO can concentrate brine to about 100,000 mg/L TDS before MVR. Evaporator size and energy can drop by up to 50%.
These packages often start above $2M on large sites. A reported 40% OPEX cut versus conventional chemical treatment is why ZLD projects still shortlist them when permits demand near-zero discharge.
Who This Is For / Who Should Look Elsewhere / Next Step
This guide is for plant engineers and procurement leads comparing RO, MBR, DAF, and multi-media trains on real influent and OPEX data. Municipal-only buyers or teams seeking a single commodity filter without permit risk should look elsewhere. Next step: lock worst-case influent, map each stage to a contaminant, then price five-year ownership—not CAPEX alone.
If you also need polished water for offices or labs beside the process train, size a Commercial Direct Drinking Water System as a separate loop after reuse quality is proven. Share your COD, TDS, and flow band with an applications engineer before freezing the P&ID.
Frequently Asked Questions
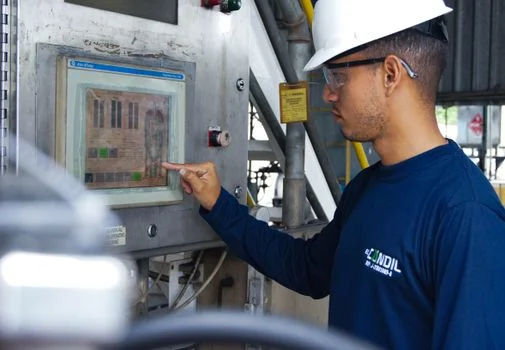
Q: How often do RO membranes need replacement in industrial settings?
A: Typically every 3–5 years. In high-fouling textile or food duty, life may fall to 1–2 years if pretreatment is weak. Track permeate flow and salt rejection weekly to plan changeouts.
Q: Can MBR systems handle phosphorus removal for compliance?
A: Yes, MBR systems for phosphorus removal in industrial wastewater can exceed 95% removal with precise coagulant dosing and often reach limits near 0.1 mg/L.
Q: What is the main difference between DAF and MBR?
A: DAF is physical separation for solids and oils as pretreatment. MBR combines biology and membranes to remove dissolved organics and fine solids in secondary or tertiary duty.
Q: What discharge standards apply to industrial water purification in the U.S.?
A: EPA NPDES limits are sector-specific. Common benchmarks include COD <120 mg/L, TSS <30 mg/L, and tight metals such as lead <0.1 mg/L.