How Does Phosphorus MBR Treatment Reach Ultra-Low Effluent Limits?
Phosphorus MBR trains with chemical precipitation remove 92–97% of total phosphorus (TP) and can meet U.S. EPA sensitive-watershed limits of ≤0.1 mg/L. Standalone biological MBRs typically remove only 30–60% TP. Hybrid designs eliminate secondary clarifiers, cut footprint by about 60%, and retain precipitates on membranes finer than 0.1 μm at ferric doses of 10–30 mg/L.
Plant engineers size these systems when permits demand ≤0.1–0.5 mg/L TP and land is tight. Municipal influent usually sits at 4–12 mg/L TP. Food-processing wastewater often reaches 10–100 mg/L, and fertilizer streams can hit 50–500 mg/L. At those loads, biological uptake alone rarely holds the permit.
Why Phosphorus Removal Is the Bottleneck in MBR Plants
Phosphorus is a limiting nutrient for freshwater eutrophication, so regulators keep effluent caps low. U.S. EPA practice for phosphorus-sensitive waters and the EU Urban Waste Water Directive 91/271/EEC commonly set TP limits from 0.1 to 2 mg/L. MBR systems remove COD at 92–97% and ammonium nitrogen (NH₄⁺-N) at 90–95% in typical municipal service. Pure biological phosphorus uptake still lags, often delivering only 30–60% TP removal when polyphosphate-accumulating organisms are poorly selected.
Industrial sources such as food processing, fertilizer manufacture, and selected chemical plants frequently discharge influent TP above 10 mg/L. Without advanced phosphorus control, those facilities face fines, permit action, and downstream algal blooms. Uncontrolled phosphorus discharge feeds harmful blooms, oxygen depletion, and aquatic dead zones such as those observed in the Gulf of Mexico. Penalties can exceed $10,000 per day under statutes such as the U.S. Clean Water Act when limits are breached repeatedly.
COD and ammonia compliance can look healthy on the weekly report while TP still fails the monthly composite. That split is why phosphorus, not organics, becomes the design driver for many MBR upgrades in sensitive basins. Space-constrained sites then prefer membrane solids separation over a new clarifier-plus-filter train that needs another plot of land.
Most plants we size for sensitive watersheds discover the bottleneck is not COD or ammonia. It is the last 0.2–0.5 mg/L of TP that biological sludge alone cannot lock down without chemical help or a polishing filter.
That residual fraction is why hybrid phosphorus MBR designs keep chemical dosing on the critical path even when PAOs look healthy in the anaerobic zone. Biology reduces chemical demand; it rarely replaces the dose entirely when the permit sits at ≤0.1 mg/L TP.
How MBRs Remove Phosphorus: Biological vs. Chemical Mechanisms
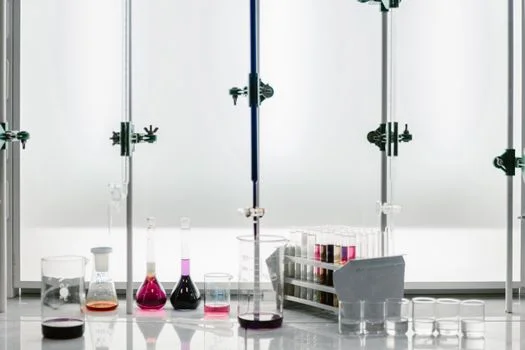
Phosphorus removal in MBR systems occurs through biological phosphorus removal (BPR), chemical precipitation, or a hybrid of both. BPR relies on polyphosphate-accumulating organisms (PAOs) cultivated under alternating anaerobic and aerobic conditions. PAOs uptake soluble orthophosphate in the anaerobic phase and store it as intracellular polyphosphate, then exit with waste activated sludge. BPR can achieve 30–60% TP removal when sludge retention time (SRT) stays near 15–30 days and hydraulic retention time (HRT) stays near 8–12 hours. Deviations from those windows invite sludge bulking or release of stored phosphorus back into the treated water.
Chemical precipitation gives a more consistent MBR phosphorus removal efficiency, typically 90–98% TP. Metal salts such as ferric chloride (FeCl₃) or alum (aluminum sulfate, Al₂(SO₄)₃) react with soluble phosphate to form insoluble FePO₄ or AlPO₄. MBR membranes with pore size below 0.1 μm retain those precipitates. Hybrid systems that combine BPR with supplemental chemical dosing are the usual route to ≤0.1 mg/L TP. Typical ferric chloride doses range from 10–30 mg/L. Where the coagulant enters the train changes both removal and fouling risk.
| Dosing Location | Pros | Cons | Typical TP Removal |
|---|---|---|---|
| Pre-MBR (e.g., anaerobic tank) | Maximizes contact time, aids BPR, reduces chemical demand | Increased sludge production, potential for scaling on upstream equipment | 85-95% |
| In-Bioreactor (e.g., aerobic tank) | Direct precipitation, MBR membranes filter precipitates | Higher risk of membrane fouling, increased chemical consumption | 90-98% |
| Post-MBR (e.g., polishing filter) | Minimizes membrane fouling, fine-tuning for ultra-low TP | Requires additional equipment, higher CAPEX, less efficient use of coagulant | 95-99% (with polishing) |
In-bioreactor dosing is the starting point for many industrial retrofits because membranes already provide the solids barrier. Post-MBR polishing is reserved for ultra-low targets when in-tank chemistry alone cannot hold ≤0.1 mg/L TP. An MBR Membrane Bioreactor Wastewater Treatment System with controlled coagulant feed is the package most plants evaluate first for that balance.
Pre-MBR dosing can cut chemical demand when contact time and BPR work together, but it raises sludge mass and can scale upstream mixers or heat exchangers. Post-MBR polishing uses coagulant less efficiently and adds CAPEX, yet it keeps sticky precipitates off the membrane surface. The dosing map is therefore a fouling decision as much as a TP decision.
How Does Chemical Precipitation Remove Phosphorus in Wastewater?
Chemical precipitation removes phosphorus in wastewater by binding soluble orthophosphate to metal salts and separating the solids on membranes or filters. Ferric chloride at 10–30 mg/L or alum at 15–40 mg/L is typical when the Fe:P or Al:P molar ratio is held near 1.5–2.5:1. Lime (calcium hydroxide) needs higher doses, often 50–150 mg/L, because calcium phosphate chemistry differs from iron or aluminum salts.
Dose math should be checked against jar tests, not left on a single spreadsheet line. For a 10 mg/L TP influent and a 2:1 Fe:P molar target, about 36.6 mg/L FeCl₃ (12% Fe) is a common calculation check (Fe molar mass ~55.85 g/mol, P molar mass ~30.97 g/mol). Bioreactor pH should stay about 6.5–7.5 for iron salts. Above roughly 8.5, precipitation efficiency falls and calcium phosphate scale risk rises. A PLC-controlled chemical dosing for phosphorus precipitation keeps ratio and pH inside those bands when diurnal load swings.
Operators who chase lower effluent TP by simply raising dose without jar tests usually create sticky precipitates, higher sludge mass, and faster transmembrane pressure rise. The cheaper path is ratio control first, then membrane scouring and CIP timing.
MBR Phosphorus Removal Specs: Influent, Effluent, and Process Parameters
Effective phosphorus wastewater treatment by MBR design starts from influent TP, the effluent permit, and sustainable membrane flux. Municipal TP typically ranges from 4–12 mg/L. Food-processing facilities often see 10–100 mg/L TP. Fertilizer plants can discharge 50–500 mg/L TP and almost always need hybrid chemical support rather than biological uptake alone.
Effluent TP targets follow the receiving water and reuse goal. For phosphorus-sensitive watershed treatment, U.S. EPA practice aims for ≤0.1 mg/L TP. The EU Urban Waste Water Directive commonly uses ≤1 mg/L. China’s GB 18918-2002 standard for municipal wastewater discharge sets ≤0.5 mg/L.
Membrane flux for PVDF flat-sheet modules in ordinary MBR duty often sits at 15–25 LMH, with some cleaner municipal trains closer to 20–30 LMH. When chemical dosing for phosphorus is integrated, a 20–40% reduction in sustainable flux is common because solids loading and ferric or alum precipitates raise fouling pressure. HRT for biological phosphorus removal alone is typically 8–12 hours. Hybrid systems with chemical dosing can meet targets at 4–6 hours HRT, which reduces bioreactor volume and civil cost.
| Parameter | Typical Range (Biological MBR) | Typical Range (Hybrid MBR with Chemical Dosing) | Unit |
|---|---|---|---|
| Influent TP (Municipal) | 4–12 | 4–12 | mg/L |
| Influent TP (Industrial - Food Processing) | 10–100 | 10–100 | mg/L |
| Influent TP (Industrial - Fertilizer) | N/A (too high) | 50–500 | mg/L |
| Effluent TP Target (Sensitive Watershed) | 0.5–2.0 | ≤0.1 | mg/L |
| Membrane Flux (PVDF Flat-Sheet) | 20–30 | 15–25 (20-40% reduction) | LMH |
| Hydraulic Retention Time (HRT) | 8–12 | 4–6 | hours |
| Ferric Chloride Dosing Rate | N/A | 10–30 | mg/L |
| Alum Dosing Rate | N/A | 15–40 | mg/L |
| Fe:P Molar Ratio | N/A | 1.5–2.5:1 | - |
PVDF flat-sheet membranes for submerged MBR applications must be sized for the lower sustainable flux once precipitants are present. Modules that ignore the 20–40% derate look fine on paper and foul within months under real chemical solids load.
Chemical dosing rates should be recalculated whenever influent TP shifts seasonally. A Fe:P molar ratio of 1.5–2.5:1 is the usual band for ferric work toward ≤0.1 mg/L TP. Alum doses of 15–40 mg/L cover many municipal hybrids, while lime at 50–150 mg/L remains a specialty choice when alkalinity and pH control can support it. The 36.6 mg/L FeCl₃ example for 10 mg/L TP at 2:1 Fe:P is a check only—jar tests still own the setpoint.
Can MBR Systems Handle High Phosphorus Loads from HTL Streams?
MBR systems can treat high phosphorus loads associated with hydrothermal liquefaction (HTL) aqueous phase only when the stream is handled as high-strength industrial wastewater. HTL aqueous cuts often resemble fertilizer or food-industry profiles, with TP well above 10 mg/L and potentially into the 50–500 mg/L band already documented for fertilizer wastewater. A biological-only MBR is not a compliance path at those concentrations.
Hybrid chemical precipitation, hybrid HRT of 4–6 hours, and Fe:P control at 1.5–2.5:1 are the practical levers. Pre-treatment for oil, grease, and TSS above about 300 mg/L protects membranes before coagulant is added. Plants that skip full characterization and jump straight to membrane area usually undersize chemical storage, sludge dewatering, and CIP capacity at the same time.
If the HTL cut also carries recalcitrant organics that suppress PAO activity, fix the carbon and toxicity picture before chasing ever-higher metal doses. Extra coagulant cannot repair a biology problem that never started.
For high-strength industrial phosphorus work, treat the MBR as a solids barrier and polishing reactor after precipitation chemistry is proven on the bench. Confirm Fe:P or Al:P on peak days, not average days. Size sludge handling for the chemical solids bump, and keep a post-MBR polishing option in the P&ID if the permit is ≤0.1 mg/L TP with little margin.
Field experience on fertilizer-like loads shows hybrid HRT of 4–6 hours is enough only when dose control is stable. When influent TP swings from 50 mg/L toward the upper industrial band near 500 mg/L, storage volume and spare dosing pumps matter as much as membrane area.
MBR vs. Conventional Systems for Phosphorus Removal: Cost, Footprint, and Performance
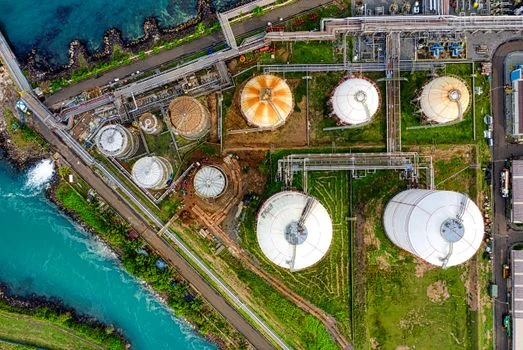
MBR versus conventional phosphorus removal differs most on footprint, CAPEX, energy, and how reliably effluent hits ≤0.1 mg/L TP. MBR trains need about 60% less land than activated sludge plus tertiary filters because secondary clarifiers and sand filters drop out. That compact layout decides many industrial sites and urban municipal retrofits with limited plot space.
CAPEX for MBR capacity typically lands at $2,500–$4,500 per m³/day of treatment capacity. Conventional activated sludge with secondary clarification and tertiary filtration is often $1,500–$3,000/m³/day. Membrane modules and automation raise MBR capital cost, while smaller bioreactors offset part of the civil works bill.
OPEX favors conventional systems on energy. MBR membrane aeration and cleaning commonly use 0.6–1.2 kWh/m³ against 0.3–0.6 kWh/m³ for conventional trains. Phosphorus chemicals add about $0.10–$0.30/m³ for both system types. MBRs also spend more on CIP chemicals when precipitants accelerate fouling and cleaning intervals tighten.
On performance, chemically assisted MBRs can hold ≤0.1 mg/L TP and produce near-reuse-quality water with TSS below 1 mg/L. Conventional tertiary filtration more often lands at 0.5–2 mg/L TP unless extra polishing is added, and TSS more often sits below 5 mg/L. COD removal above 95% is routine on hybrid MBRs versus above 90% on many conventional trains. CIP with citric acid and NaOH every 3–6 months is normal, and membrane life typically spans 5–10 years. Conventional plants trade that for clarifier desludging, filter backwash, and media replacement on a 5–15 year cycle.
| Feature | MBR + Chemical Precipitation | Conventional Activated Sludge + Tertiary Filtration |
|---|---|---|
| Footprint Reduction | Up to 60% smaller | Standard footprint |
| CAPEX (per m³/day capacity) | $2,500–$4,500 | $1,500–$3,000 |
| OPEX (Energy per m³) | 0.6–1.2 kWh/m³ | 0.3–0.6 kWh/m³ |
| OPEX (Chemicals for P removal) | $0.10–$0.30/m³ (plus CIP chemicals) | $0.10–$0.30/m³ |
| Effluent TP | ≤0.1 mg/L (consistent) | 0.5–2 mg/L (typical) |
| Effluent COD Removal | >95% | >90% |
| Effluent TSS | <1 mg/L | <5 mg/L |
| Membrane Lifespan | 5–10 years | N/A (filter media lifespan 5-15 years) |
| Maintenance | CIP every 3-6 months, membrane replacement | Clarifier desludging, filter backwash, media replacement |
When oil, grease, or high TSS threatens flux, a dissolved air flotation (DAF) machine or high-efficiency sedimentation tank upstream of the bioreactor is the usual protect step before membranes see the load.
Cost drivers that decide MBR versus conventional phosphorus trains are land price, membrane replacement reserves, energy for scour air, coagulant and sludge disposal, and the permit’s TP number. If the receiving water allows 1–2 mg/L TP, a conventional tertiary filter may win on OPEX. If the permit is ≤0.1 mg/L TP and the plot is small, the membrane train usually wins despite higher kWh/m³.
Designing an MBR System for Phosphorus Removal: Step-by-Step Engineering Checklist
Designing or retrofitting an MBR for phosphorus compliance follows a fixed sequence. Skipping influent characterization is the most common reason plants miss ≤0.1 mg/L TP after startup.
- Step 1: Characterize influent and define effluent targets. Analyze raw wastewater for TP, COD, TSS, and pH. Set the discharge limit clearly—for example ≤0.1 mg/L TP for sensitive receiving waters under U.S. EPA practice.
- Step 2: Select biological vs. hybrid system. Influent TP below about 10 mg/L may allow a BPR-focused MBR if PAOs remain stable. Above 10 mg/L TP, plan hybrid chemical precipitation from day one rather than hoping biology closes the gap later.
- Step 3: Size MBR tank and membrane area. Use HRT of 8–12 hours for biological-only duty or 4–6 hours for hybrid duty. Target sustainable flux of 15–25 LMH on PVDF flat-sheet modules and allow a 20–40% flux reduction when coagulants are dosed.
- Step 4: Integrate chemical dosing with pH control. Specify PLC dosing for ferric chloride or alum, and hold bioreactor pH at 6.5–7.5. Confirm pump turndown against the diurnal TP profile so night-time underdosing does not spike effluent TP.
- Step 5: Add pre-treatment as needed. If TSS exceeds about 300 mg/L or oil and grease is high, add DAF or a lamella clarifier before the membranes to cut fouling rate.
- Step 6: Include redundancy and fail-safes. Stock spare membrane modules, install backup dosing pumps, and automate fail-safes so chemical feed does not stop during a permit-critical shift. Pairing membranes with an integrated MBR Membrane Bioreactor Wastewater Treatment System and redundant dosing is the usual way to hold high uptime near 99% design availability.
Selection checklist for procurement reviews starts with permit TP and the sample method. Map peak TP, not just the average. Decide dosing location, derate flux for precipitants, size sludge handling for chemical solids, lock pH control, and write CIP intervals into the O&M budget before award.
Main cost drivers on the bid form are membrane area after the 20–40% chemical derate, ferric or alum storage, and day tanks. Add sludge mass from precipitation, scour-air blowers for higher MLSS, and CIP chemicals for a 3–6 month cycle across a 5–10 year membrane life. Leaving any one of those off the CAPEX sheet creates a false low bid.
Common MBR Phosphorus Removal Problems and How to Fix Them
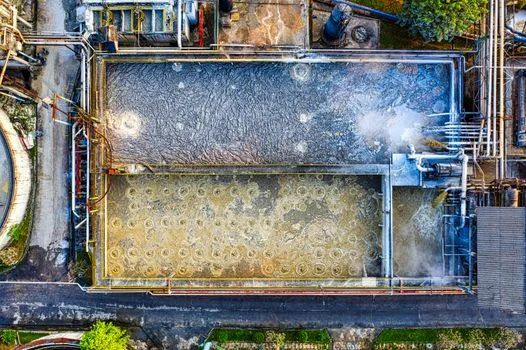
Operational problems in MBR phosphorus trains usually trace to dose ratio, pH, fouling, or PAO selection. Fix the root variable before raising chemical spend or blaming the membrane brand.
- Problem 1: High effluent TP (>0.5 mg/L) despite chemical dosing. Causes include an Fe:P or Al:P molar ratio below the 1.5–2.5:1 target, pH drift above about 8.5 for iron salts, or fouled membranes that pass colloidal solids. Run jar tests, hold pH at 6.5–7.5, and autopsy membranes if transmembrane pressure rises without a matching load change.
- Problem 2: Membrane fouling from chemical precipitants. Mixed liquor suspended solids above about 10,000 mg/L, weak scouring air, or sticky precipitates from poor dose control accelerate cake layers. Optimize MLSS, raise membrane scour air, and improve upstream TSS capture with DAF or a lamella clarifier when pre-treatment is thin.
- Problem 3: Sludge bulking in biological phosphorus removal. Low F/M (<0.1 kg COD/kg MLSS·day) or a weak anaerobic zone starves PAO selection. Adjust SRT to restore F/M, confirm the anaerobic zone is truly anaerobic and adequately sized, and dose a readily biodegradable carbon source such as acetate when PAOs need a selective push.
- Problem 4: Scaling on membranes (for example Ca₃(PO₄)₂). High pH (>8.5), lime precipitation, or hard influent forms calcium phosphate scale on membrane surfaces. Keep pH below about 8.0–8.5, run acid CIP with citric acid or hydrochloric acid, and consider softening when hardness stays chronically high. Plate-and-frame filter presses help dewater the extra chemical sludge after precipitation. Recalcitrant organics that upset BPR may need a separate advanced-oxidation review, such as Fenton oxidation screening, rather than ever-higher coagulant doses.
Who This Is For / Next Step
This approach fits municipal and industrial plants that must hit ≤0.1–0.5 mg/L TP, reuse treated water, or cut footprint by roughly 60% versus clarifier-plus-filter trains. Look elsewhere if land is cheap, the permit allows 1–2 mg/L TP, and a conventional tertiary filter already meets the number without membrane CAPEX at $2,500–$4,500/m³/day. To size flux, dose, and HRT against your permit limits, request a project quote with measured flow, TP, COD, and TSS data.
Frequently Asked Questions
What is the typical MBR phosphorus removal efficiency?
MBR systems with chemical precipitation typically remove 92–97% of total phosphorus under municipal and light industrial loads. Standalone biological MBRs usually remove only 30–60% TP when PAO selection is incomplete. Hybrid dosing is the practical path when permits require ≤0.1 mg/L TP in phosphorus-sensitive watersheds and footprint must stay compact.
How much chemical dosing is needed for phosphorus in MBRs?
Ferric chloride is commonly dosed at 10–30 mg/L to reach ≤0.1 mg/L TP effluent. Alum usually falls in the 15–40 mg/L band under the same target. Final rates follow influent TP and a Fe:P or Al:P molar ratio near 1.5–2.5:1, then jar testing confirms the number before continuous PLC control is locked in.
What are the total phosphorus effluent limits MBR systems can meet?
Chemically assisted MBRs can consistently meet ≤0.1 mg/L TP for sensitive U.S. watershed targets. EU Urban Waste Water Directive practice often uses ≤1 mg/L TP, and China’s GB 18918-2002 municipal limit is ≤0.5 mg/L. The membrane retains precipitated solids that secondary clarifiers alone may miss at peak load.
How does MBR compare with conventional phosphorus removal on cost and footprint?
MBR plants need up to 60% less footprint because secondary clarifiers are removed from the layout. CAPEX is typically $2,500–$4,500/m³/day versus $1,500–$3,000/m³/day for conventional tertiary trains. Energy is higher for MBRs at 0.6–1.2 kWh/m³, but effluent TP and TSS quality are tighter for reuse or sensitive discharges.
What causes membrane fouling from ferric chloride in MBRs?
Ferric-related fouling usually comes from MLSS above about 10,000 mg/L, weak membrane scouring air, or sticky precipitates from poor dose control. Keeping solids in range, raising scour air, and optimizing coagulant addition reduce cake-layer growth, protect flux, and cut CIP frequency over a 5–10 year membrane life.