Why Photovoltaic Acid-Alkaline Wastewater Treatment Is a 2025 Regulatory Priority
Photovoltaic acid-alkaline wastewater treatment requires specialized systems to handle high concentrations of fluoride (up to 500 mg/L), ammonia-nitrogen (up to 300 mg/L), and silica. In 2025, hybrid treatment routes combining chemical precipitation (for fluorine removal) and biological processes (for ammonia-nitrogen) achieve 99%+ contaminant removal, meeting EPA and EU discharge limits. Solar-powered zero liquid discharge (ZLD) systems further reduce water consumption by 95% and eliminate regulatory risks, with CAPEX ranging from $1.2M–$5M for a 100 m³/h plant.
Global PV manufacturing capacity reached 450 GW in 2024, generating 1.2–1.5 m³ of wastewater per MW of solar cells produced (Gao et al., 2024). This massive scaling of production has outpaced the infrastructure of many older plants, leading to severe regulatory scrutiny. Untreated or improperly treated acid-alkaline wastewater causes $250K–$1M/year in regulatory fines for non-compliant plants, particularly in regions where environmental enforcement has transitioned to real-time digital monitoring. The wastewater originates primarily from the texturing, cleaning, and etching stages of crystalline silicon cell production, where hydrofluoric acid (HF), nitric acid (HNO3), and potassium hydroxide (KOH) are used extensively.
China’s GB 8978-1996 and EU Directive 2010/75/EU impose strict limits on fluoride (≤10 mg/L), ammonia-nitrogen (≤15 mg/L), and pH (6–9). These standards are no longer merely guidelines but hard operational constraints that determine a plant's license to operate. The environmental impact of untreated PV wastewater is profound; high fluoride levels lead to groundwater contamination and dental/skeletal fluorosis in local populations, while ammonia-nitrogen causes rapid eutrophication of receiving water bodies. EPA toxicity benchmarks indicate that even short-term exposure to high-concentration PV effluent can decimate aquatic ecosystems, leading to long-term liability for manufacturing directors.
Engineering Specs: Influent Characteristics and Discharge Limits for PV Wastewater
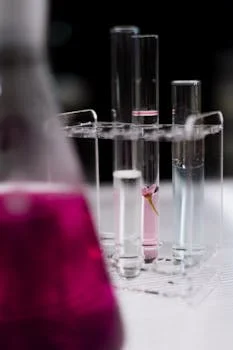
Typical PV wastewater influent concentrations are characterized by extreme pH swings and high mineral loads, specifically fluoride 200–500 mg/L, ammonia-nitrogen 100–300 mg/L, and silica 50–150 mg/L (Zhongsheng field data, 2025). Designing a treatment system requires a precise understanding of these parameters, as the high silica content can cause irreversible fouling in membrane systems if not addressed during pre-treatment. the pH typically fluctuates between 2 and 12 depending on the production cycle, necessitating robust precise chemical dosing for pH adjustment and coagulation to maintain process stability.
Effluent discharge limits vary significantly by region, but the global trend is toward harmonization with the strictest available standards. Engineers must design systems that not only meet current local codes but are "future-proofed" against the tightening limits expected by 2030. For instance, while India's CPCB has historically allowed higher fluoride levels, recent 2023 updates have brought limits closer to EU standards for plants located near sensitive ecological zones.
| Parameter | Typical Influent | China (GB 8978-1996) | EU (2010/75/EU) | US (EPA NPDES) | India (CPCB 2023) |
|---|---|---|---|---|---|
| Fluoride (mg/L) | 200–500 | ≤10 | ≤15 | ≤4.0 | ≤2.0 (Local) |
| Ammonia-N (mg/L) | 100–300 | ≤15 | ≤20 | ≤10 | ≤50 |
| pH | 2–12 | 6–9 | 6–9 | 6–9 | 5.5–9.0 |
| COD (mg/L) | 150–400 | ≤100 | ≤125 | ≤60 | ≤250 |
Influent variability is a critical factor in system design. Batch production in older PV plants creates "shock loads" that can overwhelm biological reactors. To mitigate this, engineers must implement equalization tanks with a hydraulic retention time (HRT) of at least 8–12 hours to normalize concentrations before they enter the chemical precipitation or MBR stages. Continuous production lines allow for smaller equalization volumes but require more sophisticated sensors for real-time dosing adjustments.
Treatment Routes Compared: Chemical Precipitation vs. Biological Processes vs. ZLD
Chemical precipitation remains the primary method for fluoride removal, utilizing calcium chloride (CaCl2) or lime to form calcium fluoride (CaF2) precipitates. This process effectively removes 95–99% of fluoride but generates significant waste; typically, the process results in 10–15% sludge by volume, which requires high-efficiency sludge dewatering for PV wastewater treatment to reduce disposal costs. While CAPEX for chemical precipitation is relatively low, the high OPEX associated with chemical consumption and sludge management is a significant long-term drawback.
Biological treatment, such as Anoxic/Oxic (A/O) or Membrane Bioreactor (MBR) systems, is essential for achieving 90–95% ammonia-nitrogen removal. These systems rely on nitrifying and denitrifying bacteria to convert ammonia into nitrogen gas. However, biological processes are sensitive to fluoride toxicity; fluoride concentrations must be reduced to below 20 mg/L before entering the biological stage to prevent microbial inhibition. MBR systems require a significant footprint and an HRT of 24–48 hours to ensure complete nitrogen conversion (Zhongsheng field data, 2025).
Zero Liquid Discharge (ZLD) systems represent the pinnacle of PV wastewater management, recovering 99.9% of water for reuse within the plant. These systems combine RO systems for PV wastewater pre-treatment and water recovery with thermal evaporation and crystallization. While the CAPEX is high ($1.2M–$5M for 100 m³/h), ZLD eliminates the risk of discharge non-compliance and drastically reduces the plant's freshwater footprint, which is critical in water-stressed regions like North China or the Southwestern United States.
| Treatment Route | Contaminant Removal (%) | CAPEX ($/m³) | OPEX ($/m³) | Sludge Gen (%) | Footprint (m²/100 m³/h) |
|---|---|---|---|---|---|
| Chemical Precipitation | 95–99 (F) | $8,000–$12,000 | $0.40–$0.70 | 10–15% | 400–600 |
| Biological (MBR) | 90–95 (N) | $10,000–$15,000 | $0.30–$0.50 | 1–3% | 800–1,200 |
| ZLD (Thermal) | 99.9 (All) | $40,000–$65,000 | $1.50–$3.50 | <1% (Salt) | 1,500–2,500 |
| Hybrid (Chem+Bio) | 98+ (F & N) | $15,000–$22,000 | $0.60–$0.90 | 8–12% | 1,200–1,800 |
Step-by-Step Process: Designing a Solar-Powered ZLD System for PV Wastewater
Designing a ZLD system for PV wastewater begins with robust pre-treatment to protect downstream membranes and evaporators. Step 1 involves pH adjustment and coagulation-flocculation. Engineers typically target a pH of 8.5–9.0 to maximize fluoride precipitation and use precise chemical dosing for pH adjustment and coagulation with 200–300 mg/L of Polyaluminum Chloride (PAC). This stage reduces the bulk of the fluoride and suspended solids, preventing rapid scaling in the RO membranes.
Step 2 utilizes membrane filtration, specifically ultrafiltration (UF) followed by high-pressure reverse osmosis (RO). The goal is to achieve 70–80% water recovery at this stage. RO membrane flux rates are generally maintained between 15–20 LMH (liters per square meter per hour) to balance throughput with fouling risk. Anti-scalants must be dosed specifically to target silica, as PV wastewater often contains silica levels that exceed the solubility limit of standard RO brine. The permeate from this stage is typically high enough quality to be reused in cooling towers or as feed for RO systems for PV wastewater pre-treatment and water recovery in ultrapure water (UPW) loops.
Step 3 involves thermal concentration via Mechanical Vapor Recompression (MVR) or Multi-Effect Distillation (MED). MVR is preferred in most 2025 designs due to its superior energy efficiency, consuming only 0.02–0.04 kWh per kg of water evaporated. This process concentrates the RO brine until it reaches near-saturation levels. Finally, Step 4 employs a crystallizer to convert the remaining concentrate into solid salts, achieving zero liquid discharge. The resulting solids are then processed using a high-efficiency sludge dewatering for PV wastewater treatment to achieve 30–40% solids content for easier disposal.
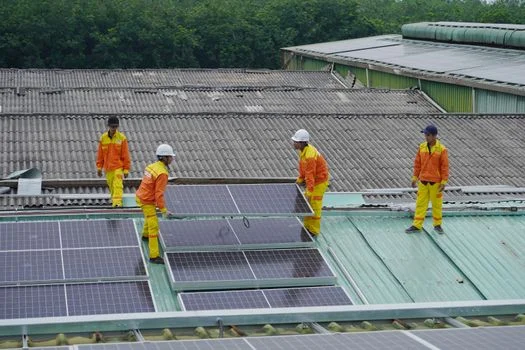
Solar integration is a significant trend for 2025, where on-site photovoltaic panels are used to power the energy-intensive MVR and RO pumps. Integrating a 1–2 MW solar array can offset 30–50% of a ZLD system's energy costs. With current electricity prices and PV hardware costs, the payback period for solar-integrated wastewater treatment is 4–6 years, making it an attractive option for sustainability-focused procurement managers (Zhongsheng field data, 2025). This setup also provides a buffer against fluctuating grid energy prices.
Cost Breakdown: CAPEX, OPEX, and ROI for PV Wastewater Treatment Systems
For a standard 100 m³/h PV manufacturing plant, the CAPEX for a conventional chemical and biological treatment system ranges from $800K to $1.5M. However, if the facility requires a ZLD system for solar cell wastewater with 99.9% recovery, the CAPEX increases significantly to $1.2M–$5M. This higher initial investment is driven by the cost of high-grade duplex stainless steel for evaporators and the sophisticated automation required to manage the complex chemistry of brine crystallization.
OPEX is dominated by chemical costs and energy consumption. In a typical hybrid system, chemicals account for 40% of the daily operating cost, primarily due to the large volumes of lime and PAC required for fluoride removal. Energy accounts for another 30%, which is where solar integration provides the most benefit. Labor and maintenance each contribute about 15% to the total OPEX. For ZLD systems, the energy component can rise to 60% of OPEX if thermal recovery is not optimized.
| Cost Component | Hybrid System (Chem+Bio) | ZLD System (Thermal) | Solar-Integrated ZLD |
|---|---|---|---|
| Annual Chemicals | $150,000–$250,000 | $80,000–$120,000 | $80,000–$120,000 |
| Annual Energy | $80,000–$120,000 | $400,000–$600,000 | $220,000–$350,000 |
| Maintenance/Labor | $100,000–$150,000 | $150,000–$200,000 | $160,000–$210,000 |
| Total Annual OPEX | $330,000–$520,000 | $630,000–$920,000 | $460,000–$680,000 |
The ROI calculation for ZLD and solar-integrated systems must account for more than just water savings. While ZLD systems reduce water purchase costs by $0.50–$1.50/m³, they also avoid potential fines of $0.20–$0.50/m³ and eliminate the need for third-party sludge disposal if the salts can be sold as industrial-grade byproducts. solar-powered ZLD systems qualify for carbon credits in EU and US markets, which can provide an additional $20,000–$50,000 in annual revenue, effectively shortening the payback period to under 5 years.
How to Select the Right Treatment System for Your PV Plant: A Decision Framework
Selecting the optimal treatment system requires a structured evaluation of influent chemistry, local regulations, and long-term financial goals. The first step is to determine the dominant contaminant. If your plant primarily produces fluoride-heavy wastewater with low nitrogen, a chemical precipitation system followed by a engineering solution for phosphorus removal in PV wastewater (as these contaminants often co-occur) is the most cost-effective path. This setup prioritizes low CAPEX but requires a dedicated sludge management plan.
For plants with high ammonia-nitrogen concentrations, typically from the use of ammonium hydroxide in cleaning steps, the focus must shift to biological integration. Implementing solar-powered systems for ammonia-nitrogen removal in PV wastewater allows for high removal efficiency while managing the energy costs of aeration. If the plant is located in a "Zero Liquid Discharge Zone" or faces extreme water scarcity, the decision is simplified: a full ZLD system is mandatory. Use the following checklist for initial system selection:
- Capacity Check: Is the flow ≤50 m³/h? Consider modular chemical precipitation. If >50 m³/h, centralized MBR or ZLD is more efficient.
- Contaminant Ratio: If F:N ratio is >5:1, prioritize chemical pre-treatment. If <2:1, focus on biological reactor stability.
- Regulatory Future-Proofing: Are local limits expected to drop by >20% in the next 5 years? If yes, invest in RO-based water recovery now.
- Land Availability: ZLD systems require 2x the footprint of chemical precipitation. Does the site allow for thermal evaporator installation?
- Energy Strategy: Does the facility have unutilized roof space for PV? Solar-integrated ZLD can reduce OPEX by 40%.
A successful implementation often requires a pilot study, especially when dealing with high-silica wastewater. Testing different anti-scalants and RO flux rates on-site for 4–6 weeks can prevent multi-million dollar mistakes in full-scale system design. Procurement managers should look for vendors who provide integrated precise chemical dosing for pH adjustment and coagulation and can demonstrate proven results in the PV sector.
Frequently Asked Questions

How does high silica content affect PV wastewater treatment? Silica is a major scaling agent in PV wastewater, often present at 50–150 mg/L. In RO and ZLD systems, silica can precipitate on membrane surfaces or evaporator tubes, causing irreversible fouling. Effective management requires maintaining pH above 10 during pre-treatment to keep silica soluble or using specialized silica-specific anti-scalants. Failure to manage silica can reduce RO membrane life from 3 years to less than 6 months.
What is the typical sludge generation rate for chemical precipitation? In PV wastewater treatment, chemical precipitation using lime or calcium chloride typically generates sludge at a rate of 10–15% of the treated water volume. This sludge is primarily composed of calcium fluoride and metal hydroxides. Utilizing a high-efficiency sludge dewatering for PV wastewater treatment can reduce the moisture content to 60–70%, significantly lowering disposal costs.
Can solar panels really power a ZLD system? While a ZLD system is energy-intensive, a well-designed solar array can offset 30–50% of the total energy demand. For a 100 m³/h plant, a 1.5 MW solar installation is typically required to provide significant OPEX reduction. The synergy is ideal because PV plants often have the land or roof space available, and the energy generated is used directly on-site, avoiding grid transmission losses and peak pricing.
What are the most common causes of non-compliance in PV plants? The most common causes are pH fluctuations that lead to poor fluoride precipitation and "shock loads" of ammonia that kill the nitrifying bacteria in biological stages. Real-time monitoring and precise chemical dosing for pH adjustment and coagulation are the best defenses against these issues. Additionally, inadequate equalization often leads to breakthrough of contaminants during peak production hours.