Why PCB Wastewater Treatment Fails: The Coupled Pollution Problem
A PCB manufacturing wastewater treatment system design splits coupled rinse water before any shared reactor. Copper arrives at 50–500 mg/L and nickel at 20–200 mg/L, and EDTA holds copper in solution even at a pH of 10.
PCB wastewater usually holds 3–5 distinct classes of pollutants, a pattern engineers call coupled pollution. Copper arrives at 50–500 mg/L, and nickel arrives at 20–200 mg/L. EDTA, citric acid, residual photoresist, and palladium catalyst share those pipes. The classes do not stay chemically separate once one header mixes them.
Copper and EDTA form a soluble complex written as Cu²⁺ + EDTA⁴⁻ → [CuEDTA]²⁻. That complex does not release free copper that can fall as Cu(OH)₂, so standard hydroxide precipitation alone misses a low metal limit. Surfactants in the same water inhibit microbial activity in a later biological stage. Field logs from mixed-header plants show a clear clarifier while dissolved copper stays in the filtrate.
Influent COD levels in rinse water can exceed 1,500 mg/L, which is enough to upset biology. A 2024 study of 12 PCB plants found that 75% failed copper compliance when complexors entered the metal line. On lines we commission, the miss shows up in the first week after a stripper dump. Hold that dump off the metal clarifier before alkali goes in.
| Pollutant Class | Typical Influent Concentration | Interactions & Challenges | Treatment Implications |
|---|---|---|---|
| Heavy Metals (Copper, Nickel) | Cu: 50–500 mg/L Ni: 20–200 mg/L |
Form soluble complexes with organic ligands (EDTA, citric acid). | Resists conventional hydroxide precipitation, requires advanced removal. |
| Organic Complexors | Variable (part of COD) | Chelate heavy metals, increasing their solubility. | Inhibit biological treatment, increase COD load. |
| Photoresists & Specialty Chemicals | Variable (part of COD, TOC) | Can be recalcitrant to biological degradation, contribute to high COD/TOC. | Require advanced oxidation processes (AOPs) for breakdown. |
| pH Extremes | pH 2–12 (from etching/cleaning) | Requires significant neutralization. | Impacts precipitation efficiency and biological treatment stability. |
Segregation Strategy for PCB Fabrication Wastewater Streams
Segregation strategy for PCB fabrication wastewater streams is the first control, because a mixed header rebuilds copper-EDTA before the clarifier. Four lines cover the usual fab: acid and alkali, heavy metals, organics, and fluoride where the etch uses it. Acid and alkali still need a neutral pH range of 6–9 before they join any other treated water. Most plants we size run that neutralization in a small day tank, not in the sewer trench.
Raw waste still arrives at pH 2–12 from etch and clean lines. PLC-controlled automatic chemical dosing pumps hold the setpoint, with pump rates of 5–50 L/h for a 10 m³/h system. Nickel concentrations exceeding 2 mg/L should not enter activated sludge, because nitrification drops off. Metal lines therefore bypass biology and go to precipitation first.
A practical map uses four collection points.
- Stream 1: Acid/Alkaline Rinse Water: Collects from general rinsing processes, requiring neutralization.
- Stream 2: Etching & Plating Rinse Water: High in heavy metals (Cu, Ni) and acids/alkalis. Requires pH adjustment and metal precipitation.
- Stream 3: Organic-Rich Streams: From photoresist stripping and cleaning, characterized by high COD/TOC. Requires advanced oxidation or specialized biological treatment.
- Stream 4: Fluoride-Containing Streams (if applicable): From specific etching or cleaning steps, requiring dedicated fluoride removal.
Each line then gets the tool that matches its load, instead of one compromise recipe. Operators usually see compliance steady once the organic dump stops entering the copper tank. Fluoride, when the etch uses it, needs its own calcium contact step and should not share the nickel settler. Label pipes at the bath, not at the combined pit.
A rinse after micro-etch can look like Stream 1 and still carry copper at the low end of 50–500 mg/L. If that line only sees acid-alkali neutralization, the copper never reaches pH 8.5–9.0. On lines we commission, a wrong pipe label is more common than a wrong reagent. Walk the floor with the process recipe and mark each rinse by bath name.
Copper Nickel Removal from PCB Rinse Water
Copper nickel removal from PCB rinse water needs two pH bands, because the metals do not drop together. Copper removal uses pH 8.5–9.0 with sodium hydroxide (NaOH) or calcium hydroxide (Ca(OH)₂). At that band, removal runs 92–97%, taking an influent of 100 mg/L down to effluent levels of 3–8 mg/L. Nickel precipitation uses a pH range typically 10–11 with NaOH, for 85–90% removal from 50 mg/L down to 5–7.5 mg/L.
Coagulants break the fine hydroxide so it can settle. Dose polyaluminum chloride (PAC) at 10–50 mg/L, or ferric chloride (FeCl₃) at 20–100 mg/L. PAM then follows at 1–5 mg/L so flocs grow large enough to drop. Most plants we size start PAC near the low end and raise it only when supernatant still carries blue color.
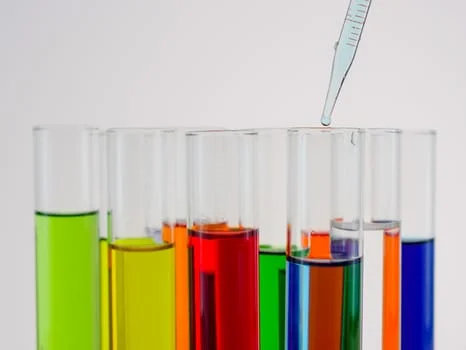
lamella clarifiers separate the solids at surface loading rates of 20–40 m/h, which corresponds to settling velocities of 0.5–1.0 m/h. Sludge volume runs 5–15% of the influent wastewater volume. A 10 m³/h system therefore yields 0.5–1.5 m³/h of sludge. plate and frame filter presses take that sludge to 30–40% solids.
Sodium hydroxide keeps calcium out of the cake when disposal cost matters. Calcium hydroxide is the bulk alkali and adds solids, which shows up once landfill sits at $100 to $300 per ton. Operators usually see copper in the 3–8 mg/L band only after pH holds for the full reaction time. Record pH at the tank outlet, not only beside the dosing point.
| Metal | Target pH Range | Typical Precipitant | Removal Efficiency (%) | Typical Influent (mg/L) | Typical Effluent (mg/L) | Coagulant Dosing (mg/L) | Flocculant Dosing (mg/L) |
|---|---|---|---|---|---|---|---|
| Copper | 8.5–9.0 | NaOH, Ca(OH)₂ | 92–97 | 100 | 3–8 | PAC: 10–50 FeCl₃: 20–100 |
1–5 (PAM) |
| Nickel | 10.0–11.0 | NaOH | 85–90 | 50 | 5–7.5 | PAC: 10–50 FeCl₃: 20–100 |
1–5 (PAM) |
Which pH Window Drops Copper Before Nickel?
Copper hydroxide forms at pH 8.5–9.0, while nickel needs typically 10–11 and should not share that higher tank. Run two reaction tanks when both metals share Stream 2. Complexed copper still will not drop until EDTA is broken. Send that sub-stream to oxidation before either pH step.
Fenton Oxidation COD Removal PCB Wastewater
Fenton oxidation COD removal PCB wastewater starts with hydroxyl radicals at a pH of 3–4. Fenton's reagent reaches 70–90% COD removal at that pH. Typical dosing involves 50–200 mg/L of H₂O₂ and 10–50 mg/L of Fe²⁺. Ozone oxidation needs 1–3 mg of O₃ per mg of COD for 60–80% removal.
Keep ozone in the pH range of 7–9, with contact times of 10–30 minutes. UV/H₂O₂ can reach 90% TOC removal at 0.5–1.0 kWh/m³ on a small polish stream. A 2024 PCB plant in Shenzhen cut COD from 2,500 mg/L to 200 mg/L. The train was Fenton's reagent followed by ozone.
Most plants we size for photoresist strip run Fenton on the organic line only. Fenton's reagent suits a high COD dump at lower capital cost. Ozone avoids a large iron sludge but uses more power. UV/H₂O₂ fits a polish step rather than the main stripper dump, with organic-line detail in PCB Organic Wastewater Treatment: 2026 Engineering Specs, 99.9% COD Re.
Membrane Filtration for Final Polishing: RO, NF, and MBR Specifications
Membrane filtration is the polish after chemistry and biology, and it carries copper from a few mg/L to the permit or reuse target. Reverse osmosis (RO) rejects 95–99% of dissolved copper and nickel at a flux of 12–18 LMH and recovery of 70–85%. Nanofiltration (NF) rejects 80–90% of divalent metals at 20–30 LMH and at lower pressure than RO. Most plants we size pick NF when the nickel column is 1.0 mg/L and RO when reuse needs TDS under 500 mg/L.
A membrane bioreactor (MBR) fits organic streams when COD is below 1,000 mg/L. The separation sheet is ultrafiltration with a pore size of 0.1 μm, and the table lists flux at 10–20 LMH. Antiscalant at 1–5 mg/L, feed pH held at 6.5–7.5, and backwashing every 30–60 minutes are the usual RO fouling controls. A VSEP RO example on this page reaches less than 0.1 mg/L of copper in permeate on polyamide thin-film composite membranes.
| Technology | Primary Application | Rejection Efficiency (Metals) | Typical Flux Rate (LMH) | Key Considerations |
|---|---|---|---|---|
| Reverse Osmosis (RO) | Final Polishing, Water Reuse | 95–99% (Cu, Ni) | 12–18 | High pressure, requires pre-treatment, 70–85% recovery. |
| Nanofiltration (NF) | Divalent Metal Removal, Partial Softening | 80–90% (Divalent Metals) | 20–30 | Lower pressure than RO, good for specific ion removal. |
| Membrane Bioreactor (MBR) | Organic Removal, Secondary Treatment | N/A (Biological) | 10–20 (UF) | Integrates biological and membrane separation, ideal for COD <1,000 mg/L. |
Do not feed an MBR with raw nickel above 2 mg/L. That ceiling belongs to segregation, and a membrane will not repair a poisoned biomass. Recovery of 70–85% means the rest of the feed leaves as concentrate still carrying rejected copper. Route that concentrate back to the metal precipitator or to a hauling tank, or the final outfall can fail while the RO skid looks healthy.
PCB Manufacturing Wastewater Treatment System Design
A 50 m³/h train on this sheet uses chemical reactors at 2–4 hours HRT and biological reactors at 6–12 hours HRT. The order below keeps chelated metal out of the bioreactor. Last-step targets are copper below 0.5 mg/L and COD below 100 mg/L. Most plants we size at this flow still end with five blocks, even when two blocks are small.
- Step 1: Segregation: Divide wastewater into streams based on pollutant type (acid/alkaline, heavy metal, organic, fluoride).
- Step 2: Chemical Precipitation: Treat heavy metal streams by adjusting pH (8.5–9.0 for Cu, 10–11 for Ni) and dosing coagulants and flocculants. Follow with sedimentation using lamella clarifiers.
- Step 3: Advanced Oxidation: For organic-rich streams (COD >1,000 mg/L), employ Fenton's reagent (pH 3–4) or ozonation to break down complex organic molecules.
- Step 4: Biological Treatment: Utilize MBR systems or conventional activated sludge for streams with residual organics (COD <500 mg/L), allowing for BOD/COD reduction.
- Step 5: Membrane Filtration: Implement RO or NF to reach effluent limits below 0.5 mg/L for copper and below 100 mg/L for COD, and to recover water.
An example arrow on the map reads Stream 1: pH 2, Cu 150 mg/L, COD 2,000 mg/L. That single line already needs a split, because metal, acid, and COD are coupled. Put those three numbers on the drawing so the bid cannot hide the load. Equipment sizing still follows the HRT bands above, not a generic tank volume.
| Stage | Technology | Key Parameters & Equipment | Typical Influent Characteristics | Typical Effluent Characteristics |
|---|---|---|---|---|
| 1. Segregation | Piping & Collection | 4-5 segregated lines | Cu: 50-500 mg/L Ni: 20-200 mg/L COD: 1000-5000 mg/L pH: 2-12 |
Separated streams for tailored treatment |
| 2. Chemical Precipitation | pH Adjustment, Coagulation, Flocculation, Clarification | Dosing pumps, chemical tanks, lamella clarifier (2-4 hr HRT) | Heavy metal streams | Cu: 3-8 mg/L Ni: 5-7.5 mg/L TSS: < 50 mg/L |
| 3. Advanced Oxidation | Fenton's or Ozone | Reactors, chemical dosing, contactors (10-30 min contact time) | Organic-rich streams (COD >1000 mg/L) | COD: 200-500 mg/L |
| 4. Biological Treatment | MBR or Activated Sludge | Bioreactor, membranes (MBR system), clarifier (6-12 hr HRT) | Residual organic streams (COD <500 mg/L) | COD: < 100 mg/L BOD: < 20 mg/L |
| 5. Membrane Filtration | RO/NF | RO modules, pre-treatment, pumps (70-85% recovery) | Treated wastewater from previous stages | Cu: < 0.5 mg/L Ni: < 1.0 mg/L COD: < 100 mg/L TDS: < 500 mg/L (for reuse) |
Hybrid AOP and Membrane PCB Wastewater Treatment
Hybrid AOP and membrane PCB wastewater treatment puts oxidation ahead of RO whenever organic-rich streams arrive above 1,000 mg/L COD. Fenton or ozone brings that load toward the table band of 200-500 mg/L before biology. Biology then targets COD under 100 mg/L, and RO or NF takes the metals the clarifier left behind. Layout and recovery cost for a sister train are in PCB Wastewater Treatment Solution 2026: Hybrid System Design with 99.8.
Freeze the piping only after this seven-point check.
- Four segregated lines, not one mixed header.
- Copper tank at pH 8.5–9.0 and a separate nickel tank at typically 10–11.
- EDTA-bearing copper diverted to Fenton at pH 3–4 before hydroxide precipitation.
- Nickel above 2 mg/L kept out of the bioreactor.
- RO feed held at pH 6.5–7.5 with antiscalant at 1–5 mg/L.
- No clean-water dilution used to meet a metal limit.
- Press operation at 6–10 bar aimed at 30–40% solids.
Regulatory Compliance: Global Standards for PCB Wastewater Discharge
Discharge design uses three columns, and the strictest cell sets the tank sizes. China's GB 21900-2008 column on this page sets copper at less than 0.5 mg/L, nickel at less than 1.0 mg/L, and a COD limit of 100 mg/L. According to the Ministry of Ecology and Environment standard page, GB 21900-2008 is the published electroplating discharge standard, took effect on 1 August 2008, and sets special water-pollutant emission limits on a mass-concentration basis.
According to US EPA, the Metal Finishing Effluent Guidelines (40 CFR Part 433) were promulgated in 1983, and the category lists printed circuit board manufacture among its core operations, with about 44,000 regulated facilities. Independent PCB manufacturers that discharge indirectly may instead fall under the Electroplating Category, 40 CFR Part 413. Check which category your permit cites before you copy a limit table.
Earlier guidance on this page used less than 1.3 mg/L for copper under 40 CFR 433 and less than 2.4 mg/L for nickel as a typical permit value. According to the text of 40 CFR 433.13, BPT for an existing direct discharger is different. Copper is 3.38 mg/L as a daily maximum and 2.07 mg/L as a monthly average. Nickel is 3.98 mg/L daily and 2.38 mg/L monthly, which is why the older 2.4 figure sits near the monthly average.
The same BPT table sets pH within 6.0 to 9.0. Total toxic organics are capped at 2.13 mg/L as a daily maximum, and no monthly average is listed for TTO. TSS limits are 60 mg/L daily and 31 mg/L monthly. Oil and grease limits are 52 mg/L daily and 26 mg/L monthly.
Section 433.13(c) also bars dilution: no user may augment process wastewater or otherwise dilute the waste stream as a substitute for adequate treatment. Sampling practice on this page stays composite for metals and grab for pH and COD. Frequency on the table is daily for metals and weekly for COD. A city pretreatment permit can be tighter than the BPT table, so the permit text wins over the federal floor.
The EU column on this page still uses IED planning values of less than 0.5 mg/L for both copper and nickel. A PCB plant in Jiangsu province, China, held full compliance across its 2024 reporting after a hybrid upgrade. That one plant result is a record for that site, not a shield for a new permit. Match the column that your outfall actually enters.
| Region/Standard | Copper (mg/L) | Nickel (mg/L) | COD (mg/L) | Sampling Protocol | Frequency |
|---|---|---|---|---|---|
| China GB 21900-2008 | < 0.5 | < 1.0 | < 100 | Composite (Metals), Grab (pH, COD) | Daily (Metals), Weekly (COD) |
| US EPA (e.g., 40 CFR 433, NPDES) | < 1.3 | < 2.4 (typical permit) | Varies by permit | Composite (Metals), Grab (pH, COD) | Daily (Metals), Weekly (COD) |
| EU IED (BAT-AELs) | < 0.5 | < 0.5 | Varies by permit | Composite (Metals), Grab (pH, COD) | Daily (Metals), Weekly (COD) |
What Monthly Copper Limit Applies Under BPT?
40 CFR 433.13 sets the copper monthly average at 2.07 mg/L for an existing direct discharger, with a daily maximum of 3.38 mg/L. Nickel monthly average on the same BPT row is 2.38 mg/L. A sewer permit can demand less than either federal number. Most plants we size to a China copper target under 0.5 mg/L are already inside the US monthly copper number.
Cost Breakdown and ROI: CAPEX, OPEX, and Payback Period for PCB Wastewater Systems
CAPEX on this page runs from $500 to $1,500 per m³/h of treatment capacity. A 50 m³/h system at that rate lands between $25,000 and $75,000. OPEX falls between $0.50 and $2.00 per m³ treated. The split given here is chemicals about 40%, energy 30%, labor 20%, and sludge disposal 10%.
Hazardous sludge landfilling is listed at $100 to $300 per ton. Penalties in the ROI notes run from $10,000 to $50,000 per violation. Hauling avoided by on-site treatment is priced at $0.10–$0.50 per gallon. Water reuse in the same notes is 20–50% of treated water.
The worked 100 m³/h case uses CAPEX of $120,000, annual OPEX of $40,000, and annual savings of $90,000, for a payback of about 2.5 years. The wider band stated with that case is 2 to 5 years. Most plants we size approach 2.5 years only when reuse actually offsets city water. If sludge is hazardous and reuse is zero, treat 2.5 years as the low edge of that one example.
OPEX between $0.50 and $2.00 per m³ moves to the top of the band when EDTA forces Fenton and sludge is hazardous. Energy near 30% of OPEX climbs if ozone replaces Fenton on the whole flow. Chemicals near 40% climb if the nickel tank holds pH 10–11 all week. Labor near 20% is the operator who owns the pH log, not a weekly walkthrough.
| Cost Component | Typical Range | Notes |
|---|---|---|
| CAPEX | $500–$1,500 / m³/h | Includes tanks, pumps, membranes, controls. |
| OPEX (per m³ treated) | $0.50–$2.00 | Chemicals (40%), Energy (30%), Labor (20%), Sludge Disposal (10%). |
| Sludge Disposal Cost | $100–$300 / ton | Hazardous waste classification typical. |
| ROI Drivers | - Avoided Penalties - Reduced Hauling Costs - Water Reuse |
Savings: $0.10–$0.50/gallon for hauling. Water recovery: 20–50%. |
| Payback Period Example (100 m³/h) | ~2.5 Years | Based on CAPEX $120k, OPEX $40k/yr, Savings $90k/yr. |
Troubleshooting Common PCB Wastewater Treatment Problems
Copper above the 0.5 mg/L discharge limit usually traces to pH, complexors, or time. Hold the copper tank at 8.5–9.0, add PAC when EDTA remains, and raise clarifier HRT into the 2–4 hours band. Check the dose log before you blame the probe. Most plants we size find the alkali pump drifted, not the sensor.
RO flux loss has three usual causes on these skids. Scaling risk rises when the Langelier Saturation Index >0. Organic fouling calls for an alkaline clean with NaOH. Dye testing is the check when salt rejection falls and the clean does not bring it back.
High COD levels (>100 mg/L) after advanced oxidation usually mean dose, pH, or load. Target 1–3 mg/mg COD for H₂O₂, and keep Fenton's reagent inside pH 3–4. An inlet TOC above reactor capacity needs ozone for the recalcitrant fraction. Test peroxide residual before you raise the pump stroke.
Excessive sludge volume (>15% of influent) often comes from too much polymer. Bring PAM back to 1–5 mg/L before you add another press. Then confirm filter presses run at 6–10 bar. A press below that pressure leaves a wet cake and makes the hopper look like a chemistry fault.
Who Should Use This Sheet
PCB fabrication plants and EPC teams use this sheet for hybrid trains from a 10 m³/h line up to the 100 m³/h example. The reader who needs it has chelated copper, nickel, and a real COD load in rinse water. A municipal plant with no metal complexors should use a simpler biological spec. Shops that only need bath makeup guidance should leave this process sheet.
Bath makeup, including pcb chemical solution tap water, is specified on the supplier page and is not sized in this train. Keep that topic off the treatment drawing. One process engineer should own the four stream names so purchasing does not collapse them into a single pit.
Next, collect a 24-hour composite for metals, a grab for COD and pH, and the permit limit that actually applies. Send those three items with a sized-train inquiry so the reply can name tanks, doses, and HRT. Do not send a mixed-header average and expect one copper target back. The sample set is what makes the sheet usable.
Frequently Asked Questions
What are the main pollutants in PCB wastewater, and why are they hard to treat?
PCB wastewater is hard because copper, nickel, EDTA, photoresist, and palladium catalyst arrive together. Copper at 50–500 mg/L and nickel at 20–200 mg/L stay soluble when EDTA is present, even at a pH of 10. Rinse COD can exceed 1,500 mg/L and slow any biological stage. A 2024 study of 12 PCB plants found that 75% failed copper compliance for that reason, so split the complexed line off the clarifier before you add alkali.
How do I choose between chemical precipitation and membrane filtration for copper removal?
Chemical precipitation is the bulk copper step, and membrane filtration is the polish. Precipitation at pH 8.5–9.0 reaches 92-97% removal and takes 100 mg/L down to 3–8 mg/L. RO then rejects 95–99% of dissolved copper and can land below 0.5 mg/L, or less than 0.1 mg/L on a VSEP permeate. NF runs at higher flux when the residual is mostly divalent metal, and most plants we size keep both steps because the clarifier misses a tight copper limit.
What is the typical payback period for a PCB wastewater treatment system?
Payback on the worked example is 2.5 years, inside a wider band of 2 to 5 years. The 100 m³/h case uses CAPEX of $120,000, annual OPEX of $40,000, and annual savings of $90,000. Those savings count penalties of $10,000 to $50,000 per violation, hauling at $0.10–$0.50 per gallon, and 20–50% water reuse. Unit CAPEX on this page is $500 to $1,500 per m³/h, and most plants we size reach the short end only when reuse replaces city water.
How can I reduce sludge production in my PCB wastewater treatment plant?
Sludge volume drops when dose stays tight and the press is loaded. Keep PAM at 1–5 mg/L so wet sludge stays inside 5–15% of influent volume, and a 10 m³/h system then makes 0.5–1.5 m³/h of sludge. Dewater it on filter presses at 6–10 bar to reach 30–40% solids. Most plants we size overfeed PAC and then buy a second press, so cut the coagulant first.
What are the latest regulatory limits for copper and nickel in PCB wastewater?
China's GB 21900-2008 column sets copper below 0.5 mg/L, nickel below 1.0 mg/L, and COD below 100 mg/L. The US federal floor in 40 CFR 433.13 is copper 3.38 mg/L daily and 2.07 mg/L monthly, with nickel at 3.98 and 2.38 mg/L. EU IED BAT-AEL planning values sit near 0.5 mg/L for both metals. Read your own permit first, because a city pretreatment limit can undercut every column above.
What copper and nickel numbers should a 2026 US direct discharger use?
Use 40 CFR 433.13 for a US direct discharger, and keep less than 1.3 mg/L copper only as background. According to that section, copper BPT is 3.38 mg/L daily and 2.07 mg/L monthly, and nickel is 3.98 mg/L daily and 2.38 mg/L monthly. The monthly nickel number sits beside the older less-than-2.4 mg/L note. This page still sizes China discharge under 0.5 mg/L copper and under 1.0 mg/L nickel.