What Semiconductor ZLD Achieves for Fab Wastewater
Semiconductor ZLD recovers about 90–99% of process wastewater as reusable water when HF, high-TDS brine, and PFAS streams are pretreated, then concentrated with FO-NF or RO-MVR. A 100 m³/h mid-sized fab train commonly costs $2.5–4M CAPEX, with OPEX near $0.8–1.5/m³ treated depending on salinity and solids. Fluoride, TDS, and PFAS limits set the recovery target.
An Arizona fab facing daily HF exceedance fines near $50,000/day shows why discharge-only treatment often fails. Hybrid trains handle HF at pH 3–5, H₂SO₄ up to about 1 M, PFAS, and high-TDS brines. According to the U.S. EPA PFAS NPDWR published April 26, 2024, drinking-water MCLs for PFOA and PFOS are 4.0 ng/L; fabs that reuse recovered water into UPW-adjacent loops treat that precedent as a design driver for PFAS barriers such as ion exchange or electrocoagulation.
Why Fabs Adopt Zero Liquid Discharge: Rules, Water Stress, and Payback
Semiconductor fabs adopt zero liquid discharge when discharge permits tighten, freshwater is scarce, or both. According to the U.S. EPA (2024), the final PFAS drinking-water rule sets PFOA and PFOS MCLs at 4.0 ng/L, with additional MCLs for PFHxS, PFNA, and HFPO-DA at 10 ng/L and a Hazard Index of 1 for certain mixtures. Those drinking-water numbers do not rewrite 40 CFR 469 overnight, but permit writers and customers increasingly expect PFAS removal inside reclaim schemes.
Water demand remains the operational lever. Many fabs pull 2–4 million gallons of ultrapure water per day; closed-loop reclaim can cut freshwater intake by about 90–95% when quality is stable (ITRS 2023 framing cited in plant studies). Most plants we size for arid sites run recovery at the lower end of the 90–95% band until silica and fluoride are proven under control.
Penalties move the spreadsheet. HF exceedances in some U.S. jurisdictions can reach about $50,000/day, while payback often lands in 3–5 years from avoided water purchase and avoided fines. TSMC’s Arizona fab reported about 30% lower municipal intake after installing full reclaim, with estimated savings near $12 million/year (TSMC 2023 sustainability report).
EU Directive 2020/2184 tightens fluoride expectations to 0.5 mg/L for sensitive receiving areas in drinking-water context, which buyers often mirror in discharge negotiations. China’s GB 31570-2025 semiconductor wastewater thresholds cited in industry briefs include fluoride at 10 mg/L and TDS at 1,000 mg/L. Taiwan EPA guidance (2023) lists fluoride near 15 mg/L, with stricter caps near reservoirs.
Semiconductor Wastewater Streams: Contaminant Profiles and Treatment Challenges
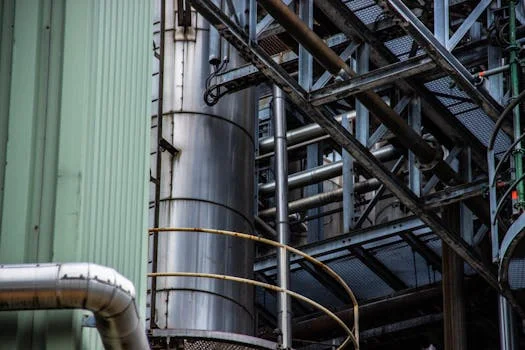
HF etch waste typically sits at pH 3–5 with fluoride up to about 1,000 mg/L. Plants usually precipitate CaF₂ first, then polish with FO or NF before any high-pressure membrane stage. High-TDS brines from rinses and scrubbers often reach 50,000–100,000 mg/L TDS and need UF plus softening before UHP RO; specialized trains such as Saltworks XtremeRO claim about 85% recovery on those feeds.
PFAS and azoles resist conventional biology. UV/H₂O₂, GAC, or ion exchange (for example Saltworks Xtract-type resin trains) are the usual barriers before evaporators. Backgrind slurry carries 10–20% w/w abrasive silica; ultrafiltration or a dedicated filter press for dewatering semiconductor backgrind waste protects downstream membranes. Cooling-tower blowdown brings CaCO₃, silica, and biocides, so softening and decarbonation—often via automated chemical dosing for HF neutralization and fluoride precipitation—come first.
| Wastewater Stream | Typical Contaminants/Profile | Key Treatment Challenge | Primary ZLD Pretreatment |
|---|---|---|---|
| Hydrofluoric Acid (HF) | HF, Fluoride (up to 1,000 mg/L), Low pH (3-5) | Fluoride precipitation, membrane scaling | CaF₂ precipitation, pH adjustment |
| High-TDS Brines | TDS (50,000-100,000 mg/L), Salts (NaCl, Na₂SO₄) | Osmotic pressure, membrane fouling | Ultrafiltration (UF), softening |
| PFAS & Azoles | Persistent organics, low concentrations | Recalcitrance, high removal efficiency | Ion exchange, GAC, Advanced Oxidation |
| Backgrind Waste | High TSS (10-20% w/w), Abrasive Silica | Solids separation, equipment wear | Ultrafiltration, filter press |
| Cooling Tower Blowdown | CaCO₃, Silica, Biocides, Moderate TDS | Scaling, biological fouling | Softening, decarbonation |
ZLD Process Flows for Semiconductor Wastewater: Engineering Parameters and Recovery Rates
FO-NF hybrids suit HF/H₂SO₄ streams. Forward osmosis typically recovers 50–70% at 10–15 LMH and low pressure, then two-stage NF lifts overall recovery to about 90–95% at 20–30 LMH. Energy for that hybrid often lands near 0.5–1.0 kWh/m³ treated when draw-solution management is tight.
High-TDS brines usually go to RO-MVR. High-recovery RO systems for ZLD brine concentration such as UHP RO (XtremeRO-class) reach about 80–85% recovery at pressures up to about 1200 psi. RO reject then feeds MVR evaporation to push total recovery to 95–99%. MVR uses about 20–30 kWh/m³ versus 60–80 kWh/m³ for once-through thermal evaporators. A crystallizer (SaltMaker MVR-class) can finish to a dry salt cake near 95% solids with less than 1% liquid waste, at roughly $3–5M CAPEX for a 100 m³/h final stage.
UF (XtremeUF-class) removes >99% TSS and colloids before RO/NF. BrineRefine-type CSTR softening drops Ca and Mg to sub-ppm levels. Reuse polish often includes chlorine dioxide generators for ZLD water reuse disinfection before the water returns to non-critical rinse or cooling service. For membrane train details, see detailed engineering specs for industrial RO systems in ZLD.
| ZLD Technology | Primary Application | Typical Recovery Rate | Flux Rate (LMH) | Energy Consumption (kWh/m³) | Key Benefit |
|---|---|---|---|---|---|
| FO-NF Hybrid | HF/H₂SO₄ acidic wastewater | 90-95% | FO: 10-15, NF: 20-30 | 0.5-1.0 | Low fouling, high acid resistance |
| RO-MVR System | High-TDS brines, general industrial | 95-99% | RO: 15-25 (UHP RO) | 20-30 (MVR only) | High recovery, energy efficiency |
| Crystallizer (MVR) | Final ZLD, dry salt production | >99.9% | N/A (Evaporation) | 30-40 (for final stage) | True zero liquid waste, reduced disposal |
Cost Breakdown: CAPEX, OPEX, and ROI for Semiconductor Reclaim Trains
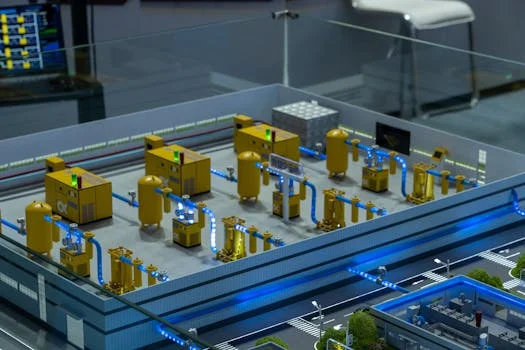
CAPEX scales with capacity and dryness target. A 50 m³/h FO-NF train for acidic waste often costs $1.5–2.5 million. A 100 m³/h RO-MVR package for high-TDS brine typically costs $2.5–4 million. Crystallizer-based full reclaim at similar hydraulic capacity often reaches $3–5 million once metallurgy, pretreatment, and automation are included.
OPEX is energy-heavy. Energy is about 40–50% of OPEX on MVR or crystallizer trains, chemicals 20–30%, membrane replacement 10–15%, and labor 5–10%. For 100 m³/h RO-MVR, OPEX commonly sits at $0.8–1.5/m³ treated at typical industrial power prices. Municipal water at $0.5–2/m³ plus avoided fines near $50,000/day for severe HF exceedances usually drive the 3–5 year payback case; HF acid reclaim can improve ROI when purity specs allow.
Hidden costs still bite. U.S. permitting can take 6–12 months. Operator training is mandatory for 24/7 fabs. Redundancy for continuous uptime often adds 10–15% to CAPEX.
| ZLD System Type (100 m³/h) | Estimated CAPEX | Estimated OPEX/m³ Treated | Typical Recovery Rate | Footprint (Relative) | Estimated Payback Period |
|---|---|---|---|---|---|
| FO-NF Hybrid | $2.0 - $3.0M | $0.7 - $1.2 | 90-95% | Medium | 3-5 years |
| RO-MVR System | $2.5 - $4.0M | $0.8 - $1.5 | 95-99% | Medium-Large | 3-5 years |
| Crystallizer-based ZLD | $3.5 - $5.0M | $1.2 - $2.0 | >99.9% | Large | 4-6 years |
What Is 20-Year TCO for Fab Ultrapure Water?
Twenty-year TCO for semiconductor ultrapure water systems is dominated by energy, membrane and resin replacement, chemical dose, and wastewater disposal—not just the initial skid price. When reclaim returns 90–99% of rinse water, freshwater purchase and sewer fees drop sharply, but evaporator power at 20–30 kWh/m³ and membrane change-outs every 3–5 years must stay in the model. Most plants we size for 20-year TCO find RO-MVR cheaper than trucked brine after year four if power is below about $0.10/kWh and municipal water exceeds about $1/m³.
Campus domestic and utility sewage still needs a separate package plant so process reclaim is not diluted by sanitary loads; an Underground Package Sewage Treatment Plant (WSZ Series) keeps non-process flows offline from the fluoride and PFAS train.
What Data Belongs in a Semiconductor UPW Piping Spec?
A semiconductor UPW piping specification needs minimum data on design flow, loop return temperature, TOC/resistivity setpoints, material (PVDF/PFA class), dead-leg limits, and sanitize method before any long-term cost comparison of Georg Fischer-type systems is meaningful. Without measured peak rinse demand and planned expansion margin, piping CAPEX quotes are not comparable. Pair those hydraulics with reclaim quality (silica, fluoride, particles) so the UPW plant is not asked to polish unstable recycle water.
UPW loop design flow margin for fab expansion typically sits at 15–30% above current peak rinse demand when a new tool bay is already funded. Confined-space-free tank cleaning methods can cut outage labor versus traditional confined-entry washes; include that delta in OPEX when comparing cleaning contractors over a 20-year horizon.
2026 Compliance Checklist: Meeting Global Standards for Fab Reclaim
U.S. EPA drinking-water MCLs for PFOA and PFOS are 4.0 ng/L under the April 26, 2024 NPDWR; they are not direct effluent limits, yet they shape reclaim and discharge negotiations. Earlier industry summaries often cited a 4 mg/L fluoride figure for semiconductors; 40 CFR Part 469 Subpart A BAT and NSPS actually set fluoride (T) at 32.0 mg/L maximum for any one day and 17.4 mg/L as a 30-day average (eCFR). Local permits can still be tighter.
EU Directive 2020/2184 drives 0.5 mg/L fluoride expectations in sensitive drinking-water contexts. China briefs citing GB 31570-2025 list fluoride at 10 mg/L and TDS at 1,000 mg/L for semiconductor wastewater. Taiwan EPA (2023) lists fluoride near 15 mg/L, with stricter caps near reservoirs. Continuous pH/TDS/fluoride logging, fail-safe diversion, and audit-ready historians are the practical compliance tools.
| Region | Parameter | 2025 Regulatory Limit | Notes |
|---|---|---|---|
| U.S. EPA | PFAS (PFOA, PFOS) | 4 ng/L (MCL for drinking water) | Influences discharge limits; finalized April 26, 2024 (earlier drafts discussed March 2024) |
| U.S. EPA | Fluoride | 4 mg/L (CWA 40 CFR 469) | Earlier summaries cited 4 mg/L; 40 CFR 469 BAT/NSPS set 32.0 mg/L daily max and 17.4 mg/L 30-day average |
| EU | Fluoride | 0.5 mg/L (sensitive areas) | Directive 2020/2184; stricter than previous |
| EU | PFAS | Pending (expected 2025) | Likely to be very stringent for industrial discharge |
| China | Fluoride | 10 mg/L (GB 31570-2025) | New standard for semiconductor wastewater |
| China | TDS | 1,000 mg/L (GB 31570-2025) | New standard for semiconductor wastewater |
| Taiwan | Fluoride | 15 mg/L | Stricter limits near reservoirs (EPA Taiwan, 2023) |
Choosing the Right Reclaim Train: Decision Framework for Semiconductor Fabs
Start with lab characterization: ICP-MS for metals, LC-MS for PFAS, plus fluoride, silica, and TDS on each segregated stream. Set the recovery goal next—about 90% reclaim favors high-recovery RO; true 99% zero liquid discharge needs evaporators or crystallizers. Crystallizers often need roughly twice the footprint of RO-MVR.
Trade CAPEX against OPEX honestly. FO-NF usually costs less upfront on acidic HF streams; RO-MVR costs more but recovers more on high-TDS brine. PLC automation can add 15–20% CAPEX while cutting labor risk—see chemical dosing systems for ZLD pretreatment and compliance. Pilot the top two options at about 1 m³/h (often near $50,000 for a rental package) before freezing the full-scale P&ID.
Selection checklist: (1) segregate HF, CMP, and rinse streams; (2) fix recovery % and solid dryness; (3) confirm PFAS barrier before evaporators; (4) size redundancy for 24/7 tools; (5) model 20-year energy and membrane OPEX; (6) lock permit fluoride/TDS limits; (7) keep sanitary flows on a separate Underground Package Sewage Treatment Plant (WSZ Series).
Who This Is For / Next Step
This guide is for fab EHS, process utilities, and EPC teams sizing HF, brine, and PFAS reclaim. Look elsewhere if you only need municipal sewage package plants with no process chemistry. To size a train against your fluoride, TDS, and reclaim specs, request a fab reclaim design review with flow and analysis sheets attached.
Frequently Asked Questions
What is the typical payback period for a fab reclaim ZLD system?
Payback for a full reclaim train usually falls between 3 and 6 years when municipal water, sewer fees, and fine risk are counted together. Water reuse savings at $0.5–2/m³ and avoided HF exceedance penalties near $50,000/day dominate the model. Crystallizer trains trend toward the longer end because CAPEX is higher. Confirm local power price before locking ROI.
How does FO-NF compare to RO-MVR for HF wastewater treatment?
FO-NF is usually preferred on HF wastewater because membranes tolerate acidity better and foul less at 10–15 LMH FO flux. Overall recovery is about 90–95% at roughly 0.5–1.0 kWh/m³. RO-MVR fits high-TDS brines better, reaching 95–99% recovery, but MVR alone uses about 20–30 kWh/m³ and needs stronger pretreatment against fluoride scaling.
What are the energy requirements for a 100 m³/h ZLD system?
Energy depends on the thermal stage. A 100 m³/h FO-NF train often uses 0.5–1.0 kWh/m³, or about 50–100 kWh/h. The MVR stage on a 100 m³/h RO-MVR system typically needs 20–30 kWh/m³, about 2,000–3,000 kWh/h for that stage alone. Crystallizers sit near 30–40 kWh/m³ on the final concentrate.
Can ZLD systems recover HF acid for reuse in semiconductor processes?
Yes, some FO-NF configurations concentrate HF enough for further purification and reuse, but purity specs decide feasibility. Etch baths need tighter control than scrubber makeup. Compare purification cost against virgin acid before claiming reclaim credit in the CAPEX case. Most plants pilot purity for several weeks before committing.
What are the maintenance requirements for ZLD systems?
RO/NF membranes typically last 3–5 years under stable pretreatment; UF membranes often need replacement every 1–2 years. Crystallizers need periodic descaling on a brine-dependent interval. Automated CIP reduces downtime if antiscalant and fluoride precipitation stay in control. Budget skilled operators for 24/7 coverage.