Primary and Secondary Treatment: Stage Roles and Limits
Primary and secondary treatment split physical solids removal from biological organics control. Primary units typically cut TSS by 50-70% at 1.5-2 hours HRT using screens, grit chambers, and clarifiers or DAF. Secondary biology then removes 85-95% of BOD in activated sludge, MBR, or trickling filters under controlled MLSS and aeration.
Primary wastewater treatment removes settleable solids, grit, and FOG before biology starts. Secondary treatment oxidizes dissolved organics left after that physical cut. Skipping either stage usually shows up as clogged membranes, high aeration energy, or effluent BOD and TSS excursions.
Why Primary and Secondary Stages Must Work Together
Poor integration of primary and secondary treatment typically cuts biological efficiency by 20-40% and raises operating cost. Industrial plants that undersize primary protection put abrasive grit and fibrous solids into aeration basins or membrane tanks. A textile plant in Gujarat bypassed primary sedimentation to save footprint; high TSS and fiber clogged MBR membranes, drove about a 30% energy spike, and triggered effluent violations.
Primary treatment is the physical shield. Screens, grit traps, and FOG removal keep large debris out of biology. When grit settles in an aeration basin, it creates dead zones, shrinks effective volume, and weakens oxygen transfer from diffusers. Earlier EPA practice notes cited in plant guidance state that even about 10% grit accumulation in secondary basins can raise aeration energy by roughly 15% to hold dissolved oxygen.
Secondary biology cannot process grit or non-biodegradable solids. Those loads wear pumps and mixers and disturb floc. China’s GB 8978-1996 and US EPA NPDES permits both set TSS and BOD limits. Meeting both consistently needs a multi-stage train: primary for bulk solids, secondary for dissolved BOD and pathogens.
Primary Treatment: Process Mechanics and Equipment Options
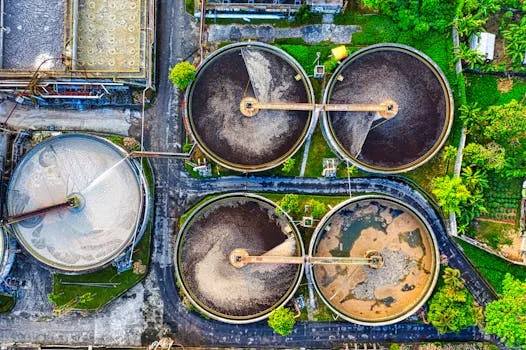
Primary treatment uses gravity and physical barriers before biological reactors. Screening comes first. GX Series rotary mechanical bar screens for primary screening typically capture 90% or more of debris larger than 6 mm. Industrial flows from 10 to 5,000 m³/h need mechanical rakes to limit head loss and overflow risk. Vortex grit chambers then target particles larger than 200 μm, often reaching 95% removal at surface loading rates of 20-30 m/h.
Primary sedimentation remains the common path for TSS cutback. Standard primary clarifiers are sized for HRT of 1.5 to 2 hours and surface overflow rate of 30-50 m³/m²/day. Operators aim for sludge volume index below 100 mL/g so solids settle cleanly. Food processing and petrochemical streams with high oils and light solids usually need DAF systems for high-FOG wastewater instead. DAF floats FOG with micro-bubbles and can reach up to 99% oil removal and 92-97% COD removal on selected industrial streams.
Choice between sedimentation and flotation follows pollutant specific gravity and available footprint. Clarifiers rely on gravity; DAF uses pressurized air and a smaller tank. Engineers should review the cost comparison of DAF and sedimentation for primary treatment against measured influent FOG and TSS before freezing CapEx.
| Equipment Type | Primary Target | Removal Efficiency (TSS) | Design Parameter (Typical) | Best Application |
|---|---|---|---|---|
| Mechanical Bar Screen | Large Debris (>6mm) | N/A (Physical capture) | Velocity: 0.6-1.0 m/s | Inlet headworks |
| Vortex Grit Chamber | Sand, Silt, Grit | 95% (>200 μm) | Surface Load: 25 m/h | Municipal & Stormwater |
| Primary Clarifier | Settleable Solids | 50-70% | HRT: 1.5-2.0 Hours | High-volume municipal |
| DAF System | FOG, Light Solids | 85-95% | Air/Solids Ratio: 0.02-0.05 | Food, Oil & Gas, Paper |
Secondary Treatment: Biological Processes and Performance Parameters
Secondary treatment oxidizes dissolved organic matter measured as BOD. In conventional activated sludge, MLSS usually sits between 2,000 and 4,000 mg/L. Keep the Food-to-Microorganism ratio near 0.2-0.5 kg BOD/kg MLSS/day so biomass stays in the growth window. Mean cell residence time of 5-15 days commonly delivers 85-95% BOD removal when oxygen and RAS are stable.
Sites with tight land or reuse-quality permits often select MBR systems for compact secondary treatment. Membranes replace secondary clarifiers, often with 0.1 μm PVDF pores. Higher MLSS of 8,000-12,000 mg/L shrinks reactor volume. Typical flux is 15-25 LMH, with energy about 0.6-1.2 kWh/m³. Benchmarks in the MBR system performance and cost benchmarks show effluent TSS commonly below 1 mg/L when pretreatment is adequate.
Nutrient control sits inside many secondary trains. Anoxic zones ahead of aeration support denitrification. Phosphorus removal often needs automated chemical dosing for nutrient removal with ferric chloride or similar coagulants. Sludge bulking (SVI > 150 mL/g) and filament foaming signal F/M, DO, or RAS imbalance. Most plants we size for industrial peak loads run RAS toward the lower end of the design band until settling recovers.
| Process Parameter | Activated Sludge (CAS) | MBR System | Trickling Filter |
|---|---|---|---|
| MLSS Concentration | 2,000 - 4,000 mg/L | 8,000 - 12,000 mg/L | N/A (Fixed Film) |
| HRT (Hydraulic Retention) | 4 - 8 Hours | 2 - 6 Hours | 1 - 3 Hours |
| BOD Removal Efficiency | 85 - 92% | 95 - 99% | 65 - 85% |
| Energy Use (kWh/m³) | 0.3 - 0.5 | 0.6 - 1.2 | 0.1 - 0.3 |
| Effluent TSS | 10 - 20 mg/L | < 1 mg/L | 15 - 30 mg/L |
Removal Rates, Costs, and Footprint Compared
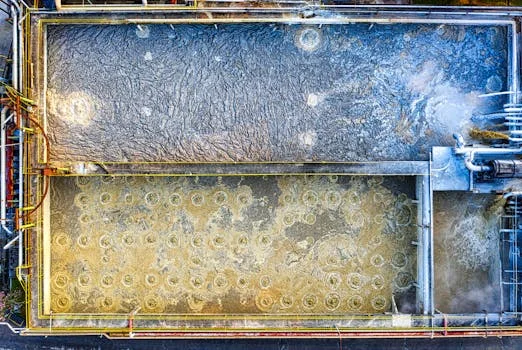
Capital and operating cost skew toward secondary treatment because aeration and biology dominate energy use. Primary treatment typically uses only 0.05-0.1 kWh/m³. Activated sludge or MBR secondary duty often runs 0.3-1.5 kWh/m³. Primary solids removal still protects membranes and diffusers and cuts the organic load entering biology.
MBR trains can cut secondary footprint by up to 60% versus conventional clarifier-based systems by deleting large secondary settlers. That matters on urban or land-tight industrial sites. Primary sludge is usually thicker (3-8% solids) and dewaters well on a plate and frame filter press for sludge dewatering. Secondary biomass sludge is thinner (0.5-2% solids) and usually needs polymer conditioning first. Compact sites that need a packaged biology train often evaluate an Underground Package Sewage Treatment Plant (WSZ Series) after primary solids control is fixed.
| Metric | Primary Treatment | Secondary Treatment | Tertiary (Context) |
|---|---|---|---|
| TSS Removal | 50 - 70% | Up to 99% (Cumulative) | 99.9% |
| BOD Removal | 25 - 40% | 85 - 95% | >99% |
| CAPEX ($/m³/day) | $150 - $400 | $300 - $1,200 | $500+ |
| OPEX ($/m³) | $0.02 - $0.05 | $0.15 - $0.45 | $0.20+ |
| Space Requirement | Moderate | High (CAS) / Low (MBR) | Low |
How do you select a primary clarifier?
Primary clarifier selection starts from peak hourly flow, settleable TSS, and FOG—not from average daily flow alone. Design HRT of 1.5-2.0 hours and SOR of 30-50 m³/m²/day remain the usual municipal band. Industrial wastewater with fibers, grit, or FOG above about 50-100 mg/L often needs stronger screening and grit removal before the clarifier, or a shift to high-rate or lamella geometry.
Match clarifier type to solids density. Heavy settleable solids favor conventional or lamella clarifiers. Light solids and FOG above 200 mg/L favor DAF. Always size sludge withdrawal for the expected dry solids mass, not only hydraulic volume. Regional discharge rules in guides such as the regional compliance requirements for wastewater treatment can force tighter primary TSS targets than generic textbook values.
| If Influent Characteristic Is... | Then Choose Primary... | And Choose Secondary... |
|---|---|---|
| High FOG (>200 mg/L) | DAF | Activated Sludge or MBR |
| High TSS, Low Footprint | DAF or High-Rate Clarifier | MBR (Integrated) |
| Municipal, High Flow | Primary Clarifier | Conventional Activated Sludge |
| Toxic/Non-biodegradable COD | Chemical Precipitation | MBR + Tertiary Carbon |
When should you choose DAF over clarifiers?
DAF outperforms gravity clarifiers when FOG exceeds about 200 mg/L or when low-density solids will not settle inside a 1.5-2 hour HRT. Air/solids ratios of 0.02-0.05 and a smaller footprint make DAF the default for food, oil and gas, and paper streams with emulsified oils. Gravity clarifiers still win on high-volume municipal flows with dense settleable solids and low FOG.
Selection checklist before freezing the train:
- Measure influent TSS, BOD, COD, and FOG on peak and average days.
- Confirm whether FOG exceeds 200 mg/L (DAF mandatory for biology protection).
- Size primary hydraulics for peak hourly flow; size secondary for average organic load.
- Check land area: MBR or package biology if secondary clarifiers will not fit.
- Verify sludge solids percent and dewatering path for primary vs secondary sludge.
- Align effluent BOD/TSS with permit (for example NPDES or GB 8978-1996 class limits).
- Budget aeration energy at 0.3-1.5 kWh/m³ for the secondary stage you select.
Pulp and paper effluent at 1,000-3,000 mg/L BOD with high fiber needs robust screening then high-rate biology. Textile streams with COD of 500-1,500 mg/L and dyes often need coagulation ahead of secondary tanks. Where a compact underground secondary package is preferred after primary FOG and solids control, the Underground Package Sewage Treatment Plant (WSZ Series) is one packaged option used on constrained sites.
Who this is for / Next step
Plant engineers and EPC teams use this comparison when sizing primary versus secondary trains for municipal or industrial wastewater. It is less useful for plants that only need tertiary polishing or metals-focused pretreatment. Share flow, BOD, TSS, FOG, and permit limits when you request a process and equipment quote so primary protection and secondary biology can be sized on the same mass balance.
Frequently Asked Questions
What is considered secondary treatment?
Secondary treatment is the biological stage that removes dissolved organic matter (BOD) and pathogens with microorganisms. Typical processes include activated sludge, MBR, and trickling filters, with about 85-95% BOD removal when MLSS and oxygen are controlled. US EPA secondary treatment definitions commonly reference effluent near 30 mg/L BOD and 30 mg/L TSS as a planning baseline for many municipal permits.
Why is primary treatment necessary before secondary treatment?
Primary treatment removes large solids, grit, and oils that clog or inhibit secondary biology. Without it, plants often see 20-40% lower BOD removal, higher aeration energy from fouled diffusers, and sludge production rising by up to about 30%. Screens, grit chambers, and clarifiers or DAF keep abrasive and bulky solids out of aeration basins and membranes.
Can secondary treatment remove heavy metals or toxic chemicals?
No. Secondary biology targets biodegradable organics and nutrients, not heavy metals or persistent chemicals. Those loads need tertiary treatment or dedicated pretreatment such as ion exchange or chemical precipitation. MBR biomass may adsorb some metals, but removal is typically under 30% for most metals and is not a compliance strategy by itself.
What are the signs that a primary clarifier is failing?
Common signs are effluent TSS above 50 mg/L, a rising sludge blanket from denitrification in the blanket, and septic odors. Corrective steps include raising sludge withdrawal, checking for short-circuiting, and dosing polymer when floc strength is weak. Persistent floating solids after those checks usually mean FOG or density problems that favor DAF over gravity settling.
How do MBR systems compare to conventional activated sludge?
MBR combines biology with membrane filtration and typically reaches about 99% TSS and 95% BOD removal with effluent near reuse quality. Footprint can be about 60% smaller than CAS with secondary clarifiers, but CapEx is often $800-$1,500/m³/day and energy about 0.6-1.2 kWh/m³. CAS remains lower energy at 0.3-0.5 kWh/m³ when land and effluent TSS of 10-20 mg/L are acceptable.