What "RO Membrane System Design Criteria" Actually Means
RO membrane system design criteria are the fixed inputs an engineer commits to in writing before pump, vessel and membrane selection: feed water quality, pretreatment chain, operating pressure, recovery, permeate quality, and energy per m3 of permeate. They are not outcomes from a pilot; they are the contractual numbers — SDI15, free chlorine, hardness, recovery — that a supplier is measured against.
Industrial RO and point-of-use RO do not share the same envelope: EPA WaterSense sets a residential benchmark of 2.3 gallons of reject or less per gallon of treated water, while industrial systems are sized to recovery up to 95%. The physical envelope is set by the membrane itself: RO pore size is in the range of 0.5 nm and operating pressure is generally between 7 and 100 bar (J Environ Health Sci Eng, 2011). Every design choice downstream — pump staging, energy recovery, antiscalant selection, rejection spec — must fit inside that envelope or it is not a defensible specification.
For a process or design engineer writing the RO section of a P&ID, the practical consequence is that the datasheet is built before the vendor is selected. Each row of the criteria table is a number the supplier can be held to at commissioning: a feed SDI15 ceiling, a permeate conductivity target, a kWh/m3 ceiling at nameplate recovery. Building the spec as a paragraph hides the trade-offs; building it as a table makes them auditable. The industrial RO system scope — feed pump, cartridge filter, high-pressure pump, membrane vessels, energy device, clean-in-place — is sized from these criteria, not the other way round.
Feed Water Characterization: The First Design Criterion
Feed water characterization is the first design criterion because every downstream number — pump duty, recovery ceiling, antiscalant dose, membrane area — is derived from it. The parameters that must be measured before an RO specification can be written are: TDS, conductivity, pH, temperature, hardness (Ca and Mg), alkalinity, silica, sulfate, chloride, COD/BOD, oil and grease, free chlorine, and SDI15. The supplied research confirms that RO removes both organic and inorganic species including hardness, color, bacteria, viruses and trihalomethane precursors (Bohdziewicz et al., as cited in J Environ Health Sci Eng, 2011). Exact limits for these parameters are not standardized in the research and must be obtained from influent characterization at each plant.
A textile dye pilot is a useful worked example. The pilot operated at four pressures (6, 8, 10 and 12 bar) across four pH values (4.5, 6.0, 7.0 and 8.3) and two feed temperatures (26°C and 39°C) to bracket the operating envelope (J Environ Health Sci Eng, 2011). Dye concentrations of 50, 55, 60 and 65 mg/L were tested. This bracketing is the standard method to write a defensible operating envelope: vary the inputs that the membrane will actually see in production and record rejection and flux at each point.
Brewery wastewater is the high-strength counter-example. Raw influent had COD 48,230 mg O2/L, BOD5 34,160 mg O2/L, and DOC 6,492 mg C/L (Membranes, 2026-07). Those values push a single-stage RO outside any sensible envelope on its own and justify a polishing-train design: a feed this strong must drop COD by an order of magnitude before the RO sees it, otherwise osmotic pressure collapses flux and recovery.
The qualitative rule, supported by both cases, is that as feed concentration rises, RO rejection rises modestly but osmotic pressure also rises, so feed strength sets both the high-pressure pump duty and the recovery ceiling. Specific osmotic pressure and saturation thresholds are not given in the supplied research; require lab confirmation per project before issuing an RFQ. The full parameter and influent characterization chain for the RO feed stream is summarized in the table below.
| Parameter | Why it matters for RO design | Source / data point |
|---|---|---|
| TDS / conductivity | Sets osmotic pressure; primary driver of high-pressure pump duty | On-line EC and TDS meters in textile pilot skid (J Environ Health Sci Eng, 2011) |
| Hardness (Ca, Mg), alkalinity, sulfate, silica | Drives CaCO3, CaSO4, BaSO4, SiO2 saturation indices and antiscalant selection | Qualitative — values project-specific, not in supplied research |
| COD / BOD / DOC | Defines whether a single-stage RO is feasible or a polishing train is required | Brewery: COD 48,230 mg O2/L; BOD5 34,160 mg O2/L; DOC 6,492 mg C/L (Membranes, 2026-07) |
| pH and temperature | Sets membrane charge, flux and rejection; bracketed in textile pilot | pH 4.5–8.3; 26°C and 39°C (J Environ Health Sci Eng, 2011) |
| Free chlorine | Oxidizes polyamide RO membranes; must be removed before RO | Qualitative — limit not in supplied research |
| SDI15 | Fouling index on the RO feed; protected by upstream multimedia / UF | Microfilter step (5 µm then 1 µm) in textile pilot reduced SDI before RO (J Environ Health Sci Eng, 2011) |
| Dye / organics concentration | Drives rejection outcome and pump pressure | Textile pilot: 50–65 mg/L dye across 6–12 bar (J Environ Health Sci Eng, 2011) |
Pretreatment Chain as a Design Criterion
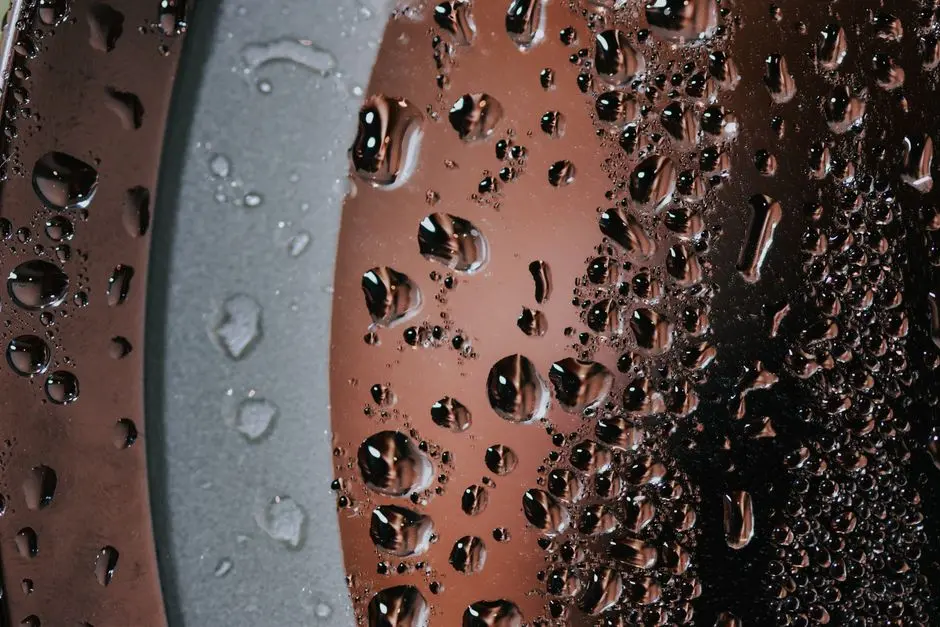
The pretreatment chain is a design criterion, not an accessory, because it protects the membrane from fouling and scaling and keeps SDI15 inside the RO envelope. The standard sequence for industrial wastewater RO is: coarse screening → grit removal → flow equalization → coagulation/flocculation → DAF or lamella clarification → RO pretreatment multi-media filter → cartridge filter (5 µm then 1 µm) → antiscalant and chemical dosing system → RO high-pressure pump. Each step removes a class of foulant; the chain as a whole is sized to deliver an RO feed that meets the membrane maker's SDI15 ceiling.
The multimedia filter step is justified by what it removes: suspended solids, turbidity and colloids, which are the SDI drivers downstream. The textile pilot used a 5 µm then 1 µm microfilter pair immediately upstream of the high-pressure pump specifically to drop SDI on the influent line to the membrane chamber (J Environ Health Sci Eng, 2011). The textile wastewater DAF design guide covers the upstream clarification step that feeds the multimedia filter.
UF is the modern alternative to MMF plus cartridge when feed SDI is high. In the brewery case, the 50 kDa UF pre-treatment preceded RO and produced the highest overall removals: 97.9% COD, 98.6% BOD5, 94.0% DOC, 92.5% chloride and 68.5% nitrate (Membranes, 2026-07). That train — sedimentation, prefiltration, coagulation, 50 kDa UF, RO — is a complete laboratory-scale polishing train and is the clearest demonstration in the supplied research that an upstream UF barrier changes the RO design envelope, not just the pretreatment.
The chemical step closes the chain. In the brewery case, PIX 113 coagulant at 2 mL/L was selected as a favourable compromise among the dosages tested (Membranes, 2026-07). Translate that selection logic to antiscalant dosing on the RO feed: choose between threshold inhibitors and dispersants based on the saturation indices of CaSO4, BaSO4, SiO2 and CaF2 in the concentrate stream. Specific dosages are project-specific and are not given in the supplied research; the design engineer should request the antiscalant projection from the membrane maker and validate it on the actual concentrate at the design recovery. A 2026 industrial wastewater management buyer's guide context is useful for sequencing chemical dosing with the rest of the train.
Operating Pressure, Recovery and Staging
Operating pressure, recovery and staging are the three design levers that translate feed characterization into a permeate specification. The RO pressure envelope is 7–100 bar (J Environ Health Sci Eng, 2011); the textile pilot ran 6–12 bar because feed TDS was low, and brackish and seawater RO sit at the upper end of that band. The recovery envelope for industrial systems runs up to 95%; the textile pilot delivered more than 72% salt reduction on cotton effluent (Avlonitis et al., as cited in J Environ Health Sci Eng, 2011) as a moderate-recovery design. Recovery should be selected as a function of feed hardness, sulfate, silica and the saturation indices of CaCO3, CaSO4, BaSO4 and SiO2 — request the antiscalant projection from the membrane maker; specific scaling limits are not in the supplied research.
Staging rules follow feed strength. A single stage is acceptable for moderate TDS and reuse duty. A two-stage array with concentrate recycle is used when higher recovery is required and the concentrate has recoverable value. A UF plus RO polishing train is the right choice when upstream BOD/COD must be reduced before RO sees it, as in the brewery case (Membranes, 2026-07). Each staging decision should appear as a line in the datasheet: number of stages, number of elements per vessel, concentrate recycle ratio, and permeate take-off per stage.
Energy per m3 of permeate is a contractual line item, not an afterthought. It scales with applied pressure times feed flow divided by permeate flow at the design recovery. Exact kWh/m3 values are not given in the supplied research; they must be requested from the RO vendor at the design recovery and pressure and entered as a ceiling in the supply contract. The table below summarizes the design parameters and the qualitative decisions an engineer should lift into an RFQ for an industrial RO system.
| Design parameter | Envelope / rule | Source / data point |
|---|---|---|
| Operating pressure | 7–100 bar envelope; low end for low-TDS reuse, upper end for brackish / seawater | J Environ Health Sci Eng, 2011 |
| Textile pilot pressure | 6, 8, 10, 12 bar tested; rejection rose with pressure | J Environ Health Sci Eng, 2011 |
| Recovery (industrial) | Up to 95% | Industrial RO system scope (HydropureWater product catalog) |
| Recovery (textile case) | More than 72% salt reduction on cotton effluent | Avlonitis et al., as cited in J Environ Health Sci Eng, 2011 |
| Single-stage rule | Moderate TDS, reuse duty | Qualitative engineering rule, not in supplied research |
| Two-stage rule | Higher recovery with concentrate recycle | Qualitative engineering rule, not in supplied research |
| UF + RO polishing | Upstream BOD/COD reduction before RO | Membranes, 2026-07 (brewery case) |
| Energy per m3 permeate | Scales with pressure × flow / permeate; exact kWh/m3 project-specific | Not in supplied research — request from RO vendor |
Permeate Quality, Rejection Targets and Validation
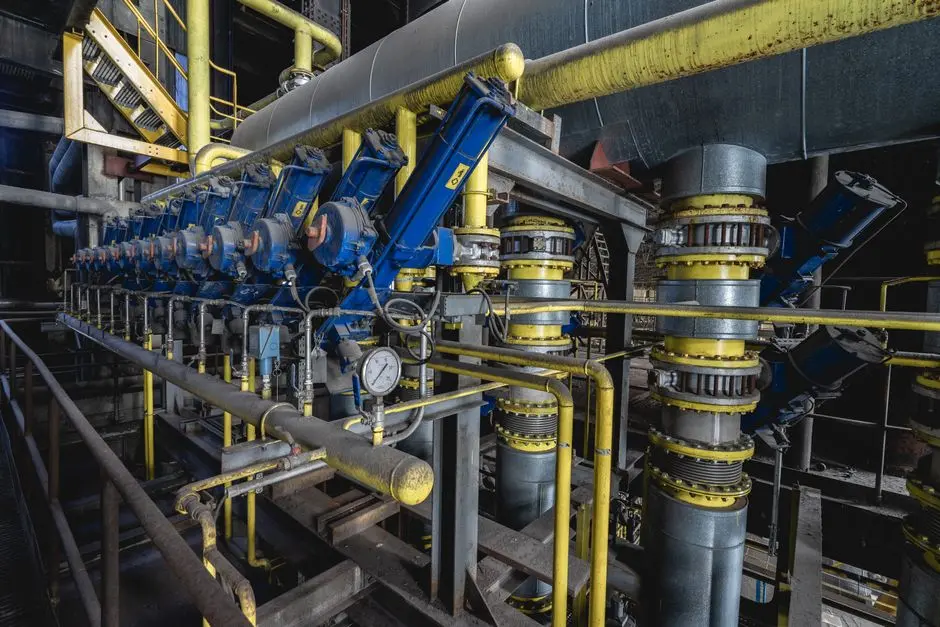
Permeate quality is the line in the datasheet that suppliers most often fudge, so the rejection targets must be lifted from the design criteria table and made into acceptance criteria at commissioning. The textile pilot delivered 96–97.2% dye removal at 8 bar, pH 8.3, on feed dye concentrations of 50–65 mg/L (J Environ Health Sci Eng, 2011). The brewery UF+RO train delivered 97.9% COD, 98.6% BOD5, 94.0% DOC, 92.5% chloride and 68.5% nitrate (Membranes, 2026-07). The NF90 membrane on textile secondary effluent delivered 99% COD reduction and 75–95% salt rejection (Gozálvez-Zafrilla et al., as cited in J Environ Health Sci Eng, 2011). These are the benchmarks the full-scale design must equal or exceed.
Translate those outcomes into acceptance criteria for the supply contract: conductivity rejection ≥95–99% on brackish feed; specific ion rejection tied to the discharge or reuse limit in the plant's permit; permeate turbidity <1 NTU; RO feed SDI15 <3 (limit not in supplied research — request from membrane maker). The rejection number must be specified per contaminant class — color, COD, conductivity, chloride, nitrate — not as a single "salt rejection" figure, because the supplier's guarantee means nothing if it cannot be checked against the right influent value.
Validation is a 2-hour steady-state run on a pilot before procurement. The textile pilot ran 2 hours to reach steady state, with samples taken every 15 minutes (J Environ Health Sci Eng, 2011). A design engineer should require that level of pilot evidence on the actual plant wastewater before issuing a purchase order for full-scale RO membrane elements and pressure vessels. Without it, the rejection numbers in the supply contract are unsupported.
Frequently Asked Questions
What does an industrial RO system cost per m3 of permeate, and what drives the budget?
The supplied research does not give a price per m3 of permeate. The drivers that should be priced into the budget are: feed TDS band (sets pump pressure and energy per m3), the pretreatment chain (UF raises capex versus MMF plus cartridge), staging (two-stage with concentrate recycle raises capex but lifts recovery), and the permeate quality target (tighter conductivity rejection raises membrane area and pump duty). The buyer should request a vendor simulation with the actual feed characterization and a stated energy per m3 ceiling at the design recovery, then price capex and opex against that envelope.
How should an engineer select an RO supplier for an industrial wastewater project?
Selection should be driven by evidence the supplier can produce on the plant's actual wastewater, not catalogue curves. Require a 2-hour steady-state pilot on real influent (as in the textile pilot methodology, J Environ Health Sci Eng, 2011) and a written projection of recovery and energy per m3 at the design pressure. Confirm the supplier can deliver the pretreatment chain — DAF or clarifier, multimedia filter, UF if the feed SDI is high, and the chemical dosing step — as an integrated scope rather than a membrane-only quote. Cross-check that the proposed RO membrane elements and pressure vessels are supported with rejection data on the same contaminant class the plant must remove.
What rejection and recovery targets should be written into the permeate specification?
Anchor the targets to the outcomes in the supplied research: textile RO delivered 96–97.2% dye removal at 8 bar and pH 8.3 (J Environ Health Sci Eng, 2011); the brewery UF+RO train delivered 97.9% COD, 98.6% BOD5 and 94.0% DOC (Membranes, 2026-07). Specify rejection per contaminant class — conductivity, color, COD, chloride, nitrate — and tie each to a measurement method. Set RO feed SDI15 to a value the membrane maker confirms, and set permeate turbidity to <1 NTU as a sanity check that the train is intact.
How long does it take to deliver and commission an industrial RO system, and what compliance risks should be reviewed?
Lead time depends on the pretreatment chain and membrane area, neither of which is quantified in the supplied research. The compliance risks an engineer should review before issuing a purchase inquiry are: discharge limits on the concentrate stream (recovery up to 95% concentrates the reject by a factor of 20, which can breach permit limits on chloride, sulfate or nitrate); the EPA WaterSense point-of-use benchmark of 2.3 gallons of reject per gallon of treated water does not apply to industrial plants, but plant permits often impose a similar recovery-based ratio — confirm the local limit; and pretreatment bypass risk during upset, which the multimedia filter, UF and antiscalant dosing must absorb without breaching SDI15 on the RO feed. Reference the sludge dewatering system selection guide for the downstream handling of the concentrate.