Where Desludging Costs Actually Come From
Sludge handling is the single largest discretionary line item in most industrial wastewater OPEX, frequently consuming 30–60% of total treatment spend once labor, energy, polymer, hauling, and tipping fees are aggregated (per published slaughterhouse wastewater benchmarks where full OPEX runs $0.18–$0.85 per m³ treated, with sludge handling typically the dominant share). The first step in optimizing that spend is decomposing the cost stack so a manager can see which lever actually moves the needle.
Three terms cause confusion in board-level conversations and should be defined up front. Desludging is the physical removal of accumulated solids from clarifiers, lagoons, DAF float chambers, and sludge holding tanks — the act of getting the material out of the process vessel. Dewatering is the mechanical reduction of water content in that removed sludge, typically via filter press, belt press, or centrifuge, producing a handleable cake. Disposal is the final off-site step: hauling the cake to landfill, incinerator, land-application site, or composter. Each step carries its own cost, and optimizing only one while ignoring the others leaves most of the savings on the table.
Sludge generation rate sets the baseline. Biological treatment typically produces 0.05–0.20 kg dry solids (DS) per m³ of wastewater treated; chemical-physical plants in food, metal finishing, and textile sectors routinely hit 0.30–0.80 kg DS/m³, and slaughterhouse streams can exceed 1.0 kg DS/m³. A food plant treating 2,000 m³/day at 0.5 kg DS/m³ generates 1,000 kg of dry solids per day — enough to fill roughly 40–50 m³ of wet sludge at 2% solids before any dewatering occurs.
Cake dryness drives the cost multiplier. Every 1 percentage-point drop in filter press cake dryness increases hauled wet tonnage by roughly 4–6%. At 2026 tipping fees of $40–$120 per wet ton (US industrial average, regional variation wide), a 3-point dryness shortfall on a 5,000-ton/year cake stream can cost an extra $50K–$180K annually — purely from water being shipped to landfill.
| Cost Component | Typical Driver | Typical Range (2026) |
|---|---|---|
| Sludge generation rate | Influent DS load × flow | 0.05–1.0+ kg DS/m³ treated |
| Polymer consumption | Conditioning dose, cake target | 5–15 kg active polymer per ton DS |
| Filter press cake dryness | Equipment, cycle, conditioning | 18–35% DS depending on technology |
| Hauling cost | Wet tonnage × distance | $8–$25 per wet ton per 50 km |
| Disposal / tipping fee | Cake classification, region | $40–$120 per wet ton |
Sludge Mass Balance: The First Optimization Lever
A defensible desludging optimization program starts with a mass balance the procurement team can audit. Without one, every downstream recommendation is guesswork. The calculation is straightforward but rarely done correctly in practice because operators measure volume, not mass, and mass is what gets paid for at the gate.
Worked example: a chemical-physical food plant treats 500 m³/day with an influent dry solids load of 0.4 kg DS/m³. Daily dry solids production = 500 × 0.4 = 200 kg DS/day. At 2% feed solids to dewatering, that 200 kg DS is carried in 10 m³ of wet sludge. At 3% feed solids (achievable with a well-operated lamella clarifier for sludge mass reduction), the same 200 kg DS sits in only 6.7 m³ — a 33% volume cut before any mechanical dewatering runs.
The governing relationship is: wet sludge mass (tons) = dry solids mass (tons) ÷ (cake dryness % ÷ 100). This single equation explains why a 2-point gain in cake dryness is worth more than a 10% gain in polymer savings, and why source-side thickening almost always beats downstream equipment upgrades on payback.
Thickening is the first cost lever because it attacks the largest volume. Increasing feed concentration from 1% to 4% solids via DAF or gravity thickener cuts downstream dewatering hydraulic load by ~75%, which in turn cuts polymer dose (smaller volume to condition), pump energy, and filter press cycle count. For a plant producing 200 kg DS/day, the difference between 1% and 4% feed solids is 20 m³/day versus 5 m³/day sent to the press — a direct reduction in operating hours, cloth loading, and polymer consumption. The mass balance also links each stream component to a downstream section: feed thickening (DAF/lamella), conditioning (polymer/FeCl₃), dewatering (filter press/belt press/centrifuge), and disposal (hauling/tipping).
Source-Side Reduction: DAF, Lamella, and Chemical Conditioning
Source reduction is consistently 3–5× cheaper per kg DS removed than downstream dewatering, because every kilogram that never enters the sludge stream eliminates polymer, energy, hauling, and tipping costs in one stroke. Three technologies dominate the source-side toolkit: DAF, lamella clarification, and chemical conditioning.
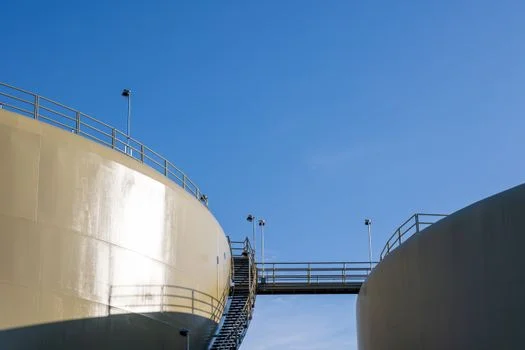
Dissolved Air Flotation thickens waste-activated sludge and floatable FOG (fats, oils, grease) to 3–5% dry solids in a single stage, with the DAF system for sludge thickening covering 4–300 m³/h as the available scale envelope. For slaughterhouse, dairy, and edible-oil streams where FOG is 30–60% of the solids load, DAF alone can halve downstream dewatering volume before any other change is made.
Lamella clarifiers with sludge recirculation operate at 20–40 m³/m²·h surface loading rates and cut coagulant use by up to 30% versus conventional clarifiers, because the recirculated solids act as nucleation sites for floc formation. The combined effect — higher underflow solids plus lower chemical consumption — directly reduces the kg DS sent forward per kg of pollutant removed. A well-designed lamella stage routinely lifts underflow from 0.5–1% to 2–3% solids, cutting downstream dewatering volume by 50–67%.
Chemical conditioning strategy is where most plants leak money. Cationic polyacrylamide (CPAM) dose typically runs 5–15 kg active polymer per ton DS, but fixed-dose setpoints with no feedback routinely dose 30–50% more polymer than the sludge actually requires. Over-dosing is the single most common OPEX leak in desludging operations, and it does not improve cake dryness — it merely sends unreacted polymer out with the cake, increasing disposal mass and cost. Pairing a PLC-controlled polymer dosing skid with online streaming-current or TSS feedback typically recovers 15–30% of polymer spend within the first quarter of operation. For high-organic industrial streams where polymer-only conditioning struggles, ferric chloride coagulation remains a viable alternative; a 2023 Springer study on El Jadida domestic wastewater confirmed FeCl₃'s effectiveness across a wide pH range, and industrial practice extends that finding to slaughterhouse and food-processing wastewaters where FeCl₃ at 50–200 mg/L followed by polymer polish often produces a tighter floc than polymer alone.
Dewatering Equipment Comparison: Filter Press vs Belt Press vs Centrifuge
The dewatering technology decision is the single largest CAPEX line in most desludging optimization projects, and the wrong choice locks in 5–10 years of suboptimal OPEX. The four technologies that cover roughly 90% of industrial applications are plate-and-frame filter press, belt filter press, decanter centrifuge, and screw press — but the buy decision in 2026 almost always comes down to the first three.
Plate-and-frame filter press delivers 22–35% cake dryness in batch operation, with 1–500 m² filtration area covering everything from a 20 m³/day food plant to a 5,000 m³/day municipal installation. Solids capture of 95–98% is the highest of any mechanical dewatering option, and at flows above 50 m³/day of sludge, OPEX per ton DS is consistently the lowest because the dryness gain compounds across every hauled ton. The trade-off is batch operation (cycle time 1–4 hours depending on cake target) and higher CAPEX per m² of filtration area.
Belt filter press runs continuously at 18–25% cake dryness, with lower CAPEX and a smaller footprint. Polymer consumption per ton DS is typically 20–40% higher than a filter press at equivalent feed, and the 4–10 point dryness gap shows up directly in hauling tonnage. Belt presses remain the right call for flows below 200 m³/day with moderate solids load and limited operator attention.
Decanter centrifuge produces 20–28% cake dryness in the smallest footprint of the three, but draws the highest energy per ton DS (typically 1.5–2.5 kWh/m³ versus 0.3–0.8 kWh/m³ for a filter press). Centrifuges are the preferred choice for oily, fibrous, or abrasive sludges — petrochemical, slaughterhouse paunch, dairy whey solids — where belt press cloth blinding or filter press cloth fouling would otherwise kill availability.
The decision rule for 2026: a 5 percentage-point cake dryness gap between technologies equals a 20–30% difference in annual sludge disposal cost at current tipping fees. The full head-to-head is laid out in the 2026 filter press vs belt press comparison, but the short version is — choose the plate-and-frame filter press for sludge dewatering when sludge volume exceeds 50 m³/day and disposal cost is the binding constraint.
| Parameter | Plate-and-Frame Filter Press | Belt Filter Press | Decanter Centrifuge |
|---|---|---|---|
| Cake dryness | 22–35% DS | 18–25% DS | 20–28% DS |
| Operation mode | Batch (1–4 hr cycle) | Continuous | Continuous |
| Solids capture | 95–98% | 90–95% | 92–96% |
| Polymer use | 5–12 kg/ton DS | 8–15 kg/ton DS | 6–14 kg/ton DS |
| Energy use | 0.3–0.8 kWh/m³ | 0.4–1.0 kWh/m³ | 1.5–2.5 kWh/m³ |
| Best-fit sludge | Municipal, food, textile | Low-to-mid flow, low FOG | Oily, fibrous, abrasive |
Process Controls and Operating Discipline That Cut OPEX
Between 10–20% of desludging OPEX can be recovered with no new mechanical equipment — purely through monitoring, dosing discipline, and operating procedure changes. This is the cheapest money in the optimization program, and it should always be sequenced before CAPEX is requested.
Online TSS or streaming-current feedback to the chemical dosing skid cuts polymer use 15–30% versus fixed-dose setpoints, because influent solids concentration varies hour-by-hour and the dose required to reach a target cake dryness varies with it. A fixed-dose plant over-conditions on every low-solids shift and under-conditions on every high-solids shift, and the under-conditioning is what shows up in wet cake and hauling tonnage.
Press cycle optimization is a second lever. A shorter cycle at higher feed pressure (e.g. 90 bar) reaches a given cake dryness faster but stresses cloth life; a longer cycle at lower pressure (e.g. 60 bar) is gentler on cloth but ties up the press. The right choice depends on whether the binding constraint is press availability (multiple shifts needed) or cloth replacement cost (a typical filter press cloth run is 800–1,200 cycles, or 3–6 months at single-shift operation).
Operator-driven desludging scheduling based on actual sludge blanket level — measured by ultrasonic or bubble probe — versus fixed calendar schedules typically cuts pumping energy 15–25% and reduces the volume of dilute sludge sent forward. Plants that pump on a fixed weekly schedule routinely pump 20–40% water with the solids; level-based scheduling pumps only when the blanket reaches the target depth. The CAPEX ask for sensor and PLC upgrades is modest — typically $15K–$60K for a mid-sized plant — and the PLC control cost and sensor upgrade pricing guide covers typical 2026 installed costs.
12-Month Cost Optimization Roadmap and ROI
A phased plan is what procurement and plant leadership will sign off on, because it separates quick wins (no CAPEX) from structural changes (CAPEX) and puts a defensible payback on each phase.
Phase 1 (months 1–3): dosing audit, SVI-based scheduling, polymer optimization. Typical OPEX reduction 8–15%, near-zero CAPEX ($0–$15K for instruments and lab work). This phase pays for itself in the first quarter and builds the mass-balance data needed to justify Phase 2.
Phase 2 (months 4–9): install DAF or lamella thickening, retrofit the chemical dosing skid. Typical OPEX reduction 15–25% (cumulative with Phase 1), CAPEX $40K–$250K depending on flow. At 500 m³/day, a DAF unit sized for the full stream plus dosing skid typically lands in the $80K–$140K range installed.
Phase 3 (months 10–12): install or upgrade the filter press, integrate online TSS feedback to the press cycle controller. Typical OPEX reduction 20–45% cumulative, CAPEX $120K–$1.5M. A 30 m² plate-and-frame press for a 500 m³/day plant is in the $150K–$280K range. Filter press lifecycle OPEX is covered in the filter press maintenance cost optimization guide, and chemical dosing strategy is detailed in the chemical dosing cost optimization playbook.
Worked ROI: a 1,000 m³/day food plant currently spending $180K/year on sludge disposal (hauling + tipping) can realistically reach $100–$115K/year within 12 months through Phases 1–2 alone, and $70–$90K/year once Phase 3 is complete. A $250K DAF + dosing upgrade (Phase 2) pays back in 4–5 years on disposal savings alone, or in 2–3 years if polymer savings are included. Add a $400K filter press upgrade and the full-program payback compresses to 3–4 years on a $250K–$300K/year baseline disposal budget.
Frequently Asked Questions
What is the biggest cost driver in industrial desludging? Hauling and tipping fees on wet cake dominate, typically 50–70% of total desludging OPEX, which is why every percentage point of cake dryness gained from dewatering equipment or polymer optimization multiplies directly into disposal savings (covered in the cost stack breakdown above).
How much can polymer dosing optimization realistically save? Plants moving from fixed-dose to feedback-controlled polymer dosing typically recover 15–30% of polymer spend within the first quarter, with the largest gains in plants where influent solids vary by 2× or more across a shift (covered in the process controls section above).
Plate press vs belt press vs centrifuge — which is cheapest per ton dry solids? For sludge volumes above 50 m³/day, the plate-and-frame filter press delivers the lowest OPEX per ton DS in 2026, primarily because its 22–35% cake dryness is 4–10 points higher than belt press or centrifuge, which compounds into 20–30% lower annual disposal cost (covered in the dewatering equipment comparison above).
How long does a desludging cost optimization program take to pay back? Phase 1 (process discipline, no CAPEX) pays back immediately. Phase 2 (DAF + dosing, $40K–$250K CAPEX) typically pays back in 2–5 years on disposal savings. Phase 3 (filter press upgrade, $120K–$1.5M CAPEX) compresses the full-program payback to 3–4 years on a $250K+/year baseline disposal budget (covered in the 12-month roadmap above).