What a Beverage Wastewater Treatment Plant Supplier Actually Delivers in 2026
A beverage wastewater treatment plant supplier in 2026 delivers a contracted scope that goes well beyond a skid of pumps: influent characterization, P&ID-level process design, equipment supply, automation, on-site commissioning, and a 12–24 month performance warranty tied to COD/BOD/TSS removal guarantees (IFC EHS Guidelines for Food & Beverage, 2024). The best suppliers will run a 30-day bench or containerized pilot on the buyer's actual effluent before locking in the train, then size the MBR flux and RO recovery against logged data, not textbook averages.
Procurement teams will encounter three supplier tiers in 2026. Global integrators (Veolia, SUEZ, Xylem, Pentair, Evoqua) sell turnkey scope with full O&M optionality but at premium CAPEX and 16–30 week delivery windows. Mid-tier regional EPCs handle civil build plus packaged equipment at 12–20 week lead times. China-direct OEMs ship containerized or skid-mounted trains at 8–12 week lead times, with documented COD removal to ≤50 mg/L on MBR effluent and RO recovery ≥85% in food and beverage deployments (HydropureWater field data, 2026).
Beverage effluent is not generic industrial wastewater. Plants see batch discharge from clean-in-place (CIP) cycles that swing pH between 2 and 12 within a single shift, seasonal sugar/BOD peaks during brewery and juice campaigns, and simultaneous FOG loading from bottle washing plus caustic detergents. The 2026 procurement shift is toward skid-mounted, PLC-controlled, factory-tested trains that compress on-site installation to 2–4 weeks and remove the civil-build risk that traditionally inflates integrator change orders.
Influent Characteristics by Beverage Sub-Sector
Five sub-sectors dominate beverage plant RFQs, and each carries a different design envelope. Sizing the screening, DAF, MBR, and RO stages against a benchmark matrix is the single fastest way to defend a budget in front of finance.
| Sub-sector | COD (mg/L) | BOD (mg/L) | TSS (mg/L) | pH | FOG (mg/L) | Temp. (°C) |
|---|---|---|---|---|---|---|
| Soft-drink bottling | 800–3,000 | 500–2,000 | 200–600 | 5–9 | 50–200 | 20–35 |
| Brewery | 2,000–6,000 | 1,500–4,000 | 500–1,500 | 4–10 | 100–400 | 25–40 |
| Dairy / liquid milk | 1,500–10,000 | 900–5,500 | 300–1,200 | 4–11 | 200–1,500 | 20–45 |
| Juice and concentrate | 2,500–6,000 | 1,800–4,500 | 400–1,000 | 3–8 | 50–300 | 20–50 |
| Distillery / spirits | 10,000–25,000 | 6,000–15,000 | 1,000–4,000 | 3–9 | 100–600 | 30–70 |
The high-variability drivers sit on top of these averages: CIP caustic/acid alternation routinely produces a pH swing of 2–12 inside an 8-hour shift, weekend clean-in-place surges can double the hourly BOD load, and seasonal campaign runs in breweries and juice plants push flow and organic load 40–60% above the design average for 6–10 weeks per year (HydropureWater field data, 2026).
Translate each range into a process implication before you call vendors. High FOG (>200 mg/L) makes DAF mandatory upstream of any biological stage. High COD (>6,000 mg/L) points to anaerobic or a high-MLSS MBR with internal recycle. High TSS (>1,000 mg/L) requires a rotary fine screen plus DAF before equalization. A deeper treatment map for the dairy case is laid out in this 2026 dairy wastewater treatment process guide.
The 2026 Reference Treatment Train: Stage by Stage
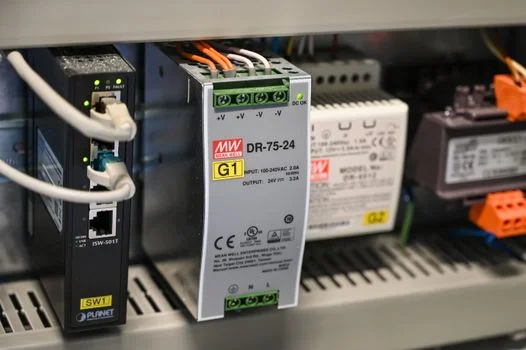
A defensible beverage train in 2026 runs five stages headworks to polish, with a 1-line collapse rule at the low end. The reference below is what a qualified supplier should put on paper before quoting.
| Stage | Equipment | Key spec | Removal / output |
|---|---|---|---|
| 1. Screening | GX series rotary mechanical bar screen | 0.5–5 mm aperture, dual overload protection | Protects downstream MBR and RO from rags and label fines |
| 2. DAF | Dissolved air flotation (DAF) system | 4–300 m³/h, 13 standard models | FOG 60–90% removal, TSS 70–90% removal |
| 3. Equalization + lamella | EQ tank with lamella clarifier | Surface loading 20–40 m/h, sludge recirculation | Cuts chemical dose ~30% versus conventional clarifier |
| 4. MBR | Integrated MBR membrane bioreactor system (PVDF, 0.1–0.4 μm) | 10–2,000 m³/day, MLSS 8,000–12,000 mg/L | COD 95–99% to ≤50 mg/L, BOD ≤5 mg/L, TSS near zero (EU 91/271/EEC) |
| 5. RO + ClO₂ | Industrial reverse osmosis (RO) system + chlorine dioxide generator | RO 70–90% recovery; ClO₂ 50 g/h to 20,000 g/h | Reuse-grade polish to WHO and EU 98/83/EC drinking-water limits |
Decision rule for the procurement team: if the beverage plant's daily flow is below 50 m³/day, the train collapses into a single containerized MBR skid with integral DAF. Above 500 m³/day, a dedicated equalization tank, separate DAF vessel, and standalone RO loop each earn their own footprint and their own maintenance access. An EU-aligned reference for civil-built industrial trains is summarized in this EU-aligned industrial wastewater engineering guide.
How to Compare Beverage Wastewater Treatment Plant Suppliers
Shortlisting should be capability-led, compliance-led, and commercial-led in that order. The framework below is what a defensible 2026 RFQ should score against, and it separates a true EPC partner from a component vendor on the first pass.
| Criterion | What to ask for | Pass threshold (2026) |
|---|---|---|
| 1. Beverage-specific pilot data | ≥30 days of logged influent/effluent COD, BOD, TSS, FOG on a similar stream | Documented, not modeled; MBR effluent COD ≤50 mg/L |
| 2. Compliance documentation | Dossiers for IFC EHS F&B, EU 91/271/EEC, EU 2020/2184, GB/T 19837, local PUCB/CPCB/EPA equivalency | All four on file, dated within 24 months |
| 3. Automation and remote monitoring | PLC + HMI, 4–20 mA loops, online BOD or TOC, SCADA-ready Modbus/OPC-UA | Standard, not optional |
| 4. Delivery model and lead time | Confirmed ship date and installation window | 8–12 weeks (China-direct OEM) vs 16–30 weeks (Western integrator) |
| 5. After-sales | Warranty term, commissioning scope, 5-year spare-parts contract | 12–24 month performance warranty + guaranteed spares |
Run this as a weighted scorecard (pilot data 30%, compliance 25%, automation 15%, delivery 15%, after-sales 15%). Any supplier that cannot produce beverage-specific pilot data, only municipal or generic-industrial data, drops out before price is discussed. Sludge-handling trade-offs that affect after-sales cost (e.g., filter press versus belt filter press) are covered in this filter press versus belt filter press comparison.
2026 CAPEX and OPEX Benchmarks by Plant Capacity
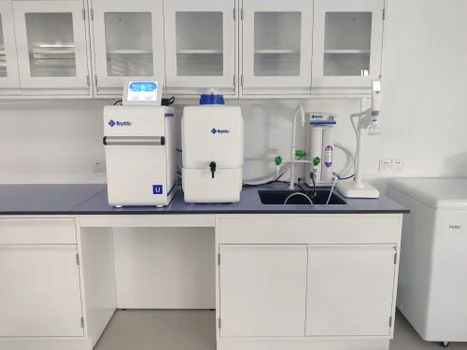
Budget ranges below are 2026 turnkey delivered prices for a five-stage train (screen → DAF → EQ → MBR → RO/ClO₂), excluding civil works and permeate reuse pumping. They separate China-direct OEM pricing from Western integrator pricing because the gap is the single biggest line item finance will question.
| Capacity (m³/day) | CAPEX, China-direct OEM | CAPEX, Western integrator | OPEX ($/m³ treated, OEM) | OPEX ($/m³ treated, integrator) | RO reuse payback |
|---|---|---|---|---|---|
| 10 | $60K–$120K | $180K–$260K | $0.18–$0.30 | $0.40–$0.65 | 24–36 months |
| 50 | $180K–$420K | $550K–$1.1M | $0.22–$0.38 | $0.45–$0.75 | 20–30 months |
| 200 | $620K–$1.4M | $1.8M–$3.2M | $0.25–$0.42 | $0.50–$0.80 | 18–30 months |
| 500 | $1.4M–$3.1M | $4.2M–$7.5M | $0.28–$0.45 | $0.55–$0.85 | 14–24 months |
OPEX energy is ~55%, chemicals ~20%, labor ~15%, membranes and spares ~10% of the per-m³ cost (HydropureWater field data, 2026). At 70% RO recovery, a 200 m³/day plant offsets roughly 50,000 m³/year of fresh water, paying back the RO premium in 18–30 months at 2026 industrial water tariffs in most regions. The CAPEX gap between OEM and integrator tiers typically closes on OPEX within 24–36 months for plants above 200 m³/day, which is the threshold where finance should be pushed toward an OEM turnkey.
Frequently Asked Questions
Q1. What influent parameters matter most when sizing a beverage wastewater treatment plant?
COD/BOD ratio, peak versus average flow, FOG, pH swing from CIP cycles (typically 2–12), and temperature. A 24-hour composite sample plus a CIP spike log is the minimum dataset a qualified supplier will accept before quoting (per IFC EHS F&B, 2024).
Q2. Can a beverage plant reuse treated wastewater for CIP or boiler feed?
Yes, with MBR plus RO at ≥80% recovery and a ClO₂ or UV polish, treated effluent meets EU 2020/2184 reuse thresholds for process water. Boiler feed typically requires an additional softener or EDI polish downstream of the RO.
Q3. Containerized versus civil-built treatment plant — which suits a beverage facility?
Containerized for flows under 100 m³/day and tight sites with 2–4 week install windows. Civil-built for 200+ m³/day with future expansion headroom, dedicated equalization, and on-site RO cleaning bays.
Q4. How long does installation and commissioning take?
8–12 weeks for a skid-mounted OEM train versus 6–10 months for a Western integrator turnkey, including pilot, permitting, and performance testing. The gap is driven by FAT scope and civil-build dependency.
Q5. What certifications should a 2026 beverage wastewater supplier hold?
ISO 9001 and 14001, CE/PED where applicable, and compliance dossiers for IFC EHS Food & Beverage, EU 91/271/EEC, and WHO drinking-water guidelines. GB/T 19837 applies for China-supplied MBR modules shipped into the domestic market.