What Makes Electronics Assembly Wastewater Different
Electronics assembly wastewater comes from three discrete process streams that have almost nothing in common with municipal sewage: electroless copper plating rinsate (Cu 20–200 mg/L, EDTA-complexed), nickel and gold plating rinsate (Ni 5–50 mg/L, often with ammonia-complexed species), and solder cleaning effluent carrying Sn/Pb 5–30 mg/L plus high surfactant loads from flux drag-out. NH3-N typically runs 20–200 mg/L from ammoniacal etching baths, COD lands at 200–1,500 mg/L, and free cyanide can be present in spent plating baths. Municipal sewage by contrast sits at COD 250–600 mg/L with only trace metals, and is fully treatable by primary clarification plus activated sludge. The colloidal and dissolved metal fraction in PCB rinsate is not removed by gravity settling, which is exactly why a generic package plant from a sewage-equipment catalog will not pass 40 CFR 433 — the underlying chemistry is different, not just the concentrations (per ScienceDirect WWTP overview). When evaluating an electronics assembly wastewater treatment plant supplier, the first test is whether they recognize this stream-specific chemistry or default to municipal-style design.
| Parameter | PCB rinsate (typical) | Municipal sewage |
|---|---|---|
| Copper (Cu) | 20–200 mg/L | <0.1 mg/L |
| Nickel (Ni) | 5–50 mg/L | <0.05 mg/L |
| Sn/Pb (total) | 5–30 mg/L | <0.5 mg/L |
| NH3-N | 20–200 mg/L | 20–40 mg/L |
| COD | 200–1,500 mg/L | 250–600 mg/L |
| Free cyanide | 0–50 mg/L (sporadic) | Negligible |
| FOG / flux surfactants | 50–500 mg/L | 20–50 mg/L |
Discharge Standards a Supplier Must Help You Meet
Three regulatory frameworks govern where your plant ships, and any qualified vendor should be able to name all three in the first technical call. Under U.S. EPA 40 CFR 433 Metal Finishing, daily maximum limits are Cu 4.5 mg/L, Ni 4.1 mg/L, Pb 0.69 mg/L, Zn 4.3 mg/L, total metals 10.5 mg/L, and oil & grease 52 mg/L (per 40 CFR 433.102). In China, GB 39731-2020 sets the electronic industry direct-discharge table at Cu 0.5 mg/L and Ni 0.5 mg/L — roughly an order of magnitude tighter than the U.S. metal-finishing rule — with indirect-discharge COD at 500 mg/L. The EU Industrial Emissions Directive 2010/75/EU, applied through the Surface Treatment of Metals and Plastics BAT reference document, drives BAT-AELs to 0.2–0.5 mg/L for both Cu and Ni at the wastewater treatment plant outlet. If a supplier's public profile does not name at least one of these standards, or claims ISO 14001 without naming a discharge category, that is a buyer-risk signal: many Alibaba top-ranked vendors (1–3 year platform tenure, 40–90% domestic-market revenue) publish no compliance references at all. Put the limits below into your RFQ and disqualify bidders who cannot show prior compliance against the same numbers.
| Standard | Cu limit | Ni limit | Pb limit | COD limit |
|---|---|---|---|---|
| U.S. 40 CFR 433 (daily max) | 4.5 mg/L | 4.1 mg/L | 0.69 mg/L | — |
| China GB 39731-2020 (direct) | 0.5 mg/L | 0.5 mg/L | 0.2 mg/L | 500 mg/L (indirect) |
| EU IED 2010/75/EU BAT-AEL | 0.2–0.5 mg/L | 0.2–0.5 mg/L | 0.1–0.5 mg/L | Site-specific |
The Standard Treatment Train: Precipitation, Bio, Membrane
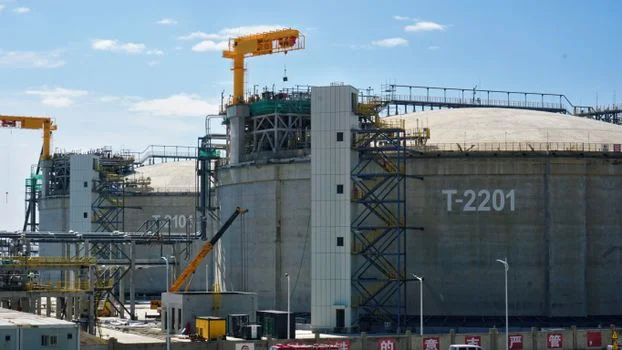
Stage 1 is chemical precipitation: NaOH or lime raises pH to 9.0–10.0, dropping Cu, Ni, and Zn as hydroxide floc with 95–99% removal in a 1–2 hour HRT lamella clarifier. A secondary Na2S dose polishes residual dissolved metals down to <1 mg/L where the plant must meet the tighter GB 39731-2020 direct-discharge table. Stage 2 is biological polishing — an MBR membrane bioreactor for biological polishing with submerged PVDF at 0.1 μm, or an SBR for smaller flows — to drive COD down 60–80% and complete NH3-N nitrification at 90–95% removal. Stage 3 is membrane polishing: a DAF system for suspended solids and flux removal upstream, then UF (0.01–0.1 μm) protecting the industrial RO system for water reuse, which runs at 95% recovery and produces permeate suitable for rinsing-water reuse. Spent metal hydroxide sludge is dewatered on a plate-and-frame filter press for metal sludge to 30–40% DS before licensed hazardous-waste disposal. Realistic stage-by-stage removal efficiencies: Cu 99.5%, Ni 99%, COD 92–97%, NH3-N 90–95% (HydropureWater field data, 2026).
| Stage | Unit operation | Key design parameter | Target removal |
|---|---|---|---|
| 1. Precipitation | Lamella clarifier + Na2S polish | pH 9–10, HRT 1–2 h | Cu/Ni to <1 mg/L |
| 2. Biological | MBR (PVDF 0.1 μm) or SBR | MLSS 8,000–12,000 mg/L (MBR) | COD 60–80%, NH3-N 90–95% |
| 3a. UF guard | Hollow-fiber UF | 0.01–0.1 μm pore | SDI <3 to RO |
| 3b. RO polish | BWRO / brackish RO | 75–95% recovery | TDS <50 mg/L permeate |
| 4. Sludge | Plate-and-frame press | 30–40% DS cake | Hazardous-waste disposal |
Comparing Process Trains: MBR, SBR, and DAF + UF
The three credible process configurations for a 50–500 m³/d electronics assembly plant behave very differently at the procurement stage. MBR carries the highest CAPEX line but a footprint roughly 60% smaller than SBR at the same flow, effluent is reusable for rinsing without further polishing, and the membrane replacement cycle runs 5–8 years for submerged PVDF. SBR lowers CAPEX by 20–30% at flows under 200 m³/d, has no membrane replacement cost, and operates simply — but its effluent needs tertiary RO before any reuse is possible. DAF + UF is the right call when the binding compliance driver is metal load and FOG from solder flux, since DAF removes suspended solids and emulsified flux within 20–30 minutes of HRT, well before biological kinetics become the bottleneck. The decision rule: choose MBR if reuse exceeds 50% of treated flow, choose SBR if the plant is discharge-only and CAPEX-constrained, and choose DAF + UF if the influent metal and FOG load is the dominant compliance risk. Many of the comparison points in our high TDS wastewater treatment guide apply directly to the RO polishing tail on each train.
| Criterion | MBR | SBR | DAF + UF |
|---|---|---|---|
| Best-fit flow | 10–2,000 m³/d | <200 m³/d | 50–500 m³/d |
| Relative CAPEX | High (baseline 1.0) | 0.7–0.8× | 0.6–0.7× |
| Footprint | Compact (60% of SBR) | Largest | Compact, vertical |
| Reuse-ready effluent | Yes (direct to RO) | No (needs RO polish) | Yes (RO downstream) |
| Membrane replacement | Every 5–8 yr (PVDF) | None | UF every 3–5 yr |
| Best when | Reuse >50% flow | Discharge-only, low CAPEX | High FOG / flux / metal load |
CAPEX and OPEX: What a Realistic Budget Looks Like
Installed CAPEX for a full precipitation + bio + RO train at 50–500 m³/d runs $250–$850 per m³/d, with precipitation + MBR + RO sitting at the upper end of that range. Membranes and sludge handling typically absorb 60–70% of total installed cost; automation and civil works take most of the rest. OPEX breaks down roughly as chemical dosing (NaOH, Na2S, flocculant, antiscalant) at 25–35%, energy at 20–30%, membrane replacement at 15–20%, sludge disposal at 15–25%, and labor at 5–10% (industrial WWTP OPEX data, 2025-12). The most commonly underestimated line is sludge: metal hydroxide cake from a 200 m³/d plant can run $200–$500 per ton for licensed hazardous-waste disposal, and a plate-and-frame press producing 30–40% DS cake at 2–4% of feed flow still leaves a meaningful monthly tonnage. Full MBR/RO operating cost lands in the $0.45–$1.20 per m³ treated range, which is the number to anchor any vendor conversation. For a cross-check, our copper foil wastewater treatment cost benchmark and battery recycling wastewater cost breakdown use the same accounting framework with metal-specific adjustments.
| Cost line | Range / share | Note |
|---|---|---|
| Full-train CAPEX | $250–$850 per m³/d installed | 50–500 m³/d scope |
| Membranes + sludge handling | 60–70% of CAPEX | RO cassettes, UF modules, press |
| Chemicals (OPEX) | 25–35% of OPEX | NaOH, Na2S, flocculant, antiscalant |
| Energy (OPEX) | 20–30% of OPEX | Blowers, pumps, RO HP pump |
| Membrane replacement (OPEX) | 15–20% of OPEX | 5–8 yr MBR, 3–5 yr UF, 3 yr RO |
| Sludge disposal (OPEX) | 15–25% of OPEX | $200–$500 per ton hazardous |
| Total treatment cost | $0.45–$1.20 per m³ treated | Full MBR/RO operating data |
How to Vet an Electronics Assembly Wastewater Supplier
Five checks separate a real systems integrator from a trading-company reseller. First, confirm direct manufacturing: ask for factory audit reports, welding procedure specifications, and ISO 9001 / ISO 14001 certificates tied to a specific facility, not a group holding. Second, require a guaranteed performance bond tied to specific effluent parameters — Cu ≤0.5 mg/L, Ni ≤0.5 mg/L, COD ≤500 mg/L — not just equipment delivery against a purchase order. Third, validate reference installations in PCB, electronics assembly, or surface treatment, not generic municipal sewage. Fourth, confirm post-commissioning support: membrane replacement lead time (target ≤6 weeks for RO elements), spare parts inventory in your region, and 24/7 process troubleshooting. Fifth, scrutinize commercial maturity: Alibaba top-ranked sewage-treatment listings frequently show 1–3 year platform tenure and 40–90% domestic-market revenue, which signals limited export track record and is a real cross-border risk. A supplier that passes all five will also be able to document a P&ID that matches the precipitation → bio → membrane train in the previous section without modification.
Frequently Asked Questions
What effluent limits should we put in an electronics assembly wastewater RFQ?
For U.S. discharge, cite 40 CFR 433 daily maxima: Cu 4.5 mg/L, Ni 4.1 mg/L, Pb 0.69 mg/L, total metals 10.5 mg/L. For China projects, cite GB 39731-2020 direct-discharge values of Cu 0.5 mg/L and Ni 0.5 mg/L — both achievable with Na2S polishing after hydroxide precipitation.
MBR or SBR for a 150 m³/d PCB rinsate plant?
MBR is the right call at 150 m³/d when reuse exceeds 50% of treated flow, because SBR effluent still needs a tertiary RO to reach rinsing-water quality. MBR submerged PVDF at 0.1 μm produces reusable permeate directly and shrinks the footprint to roughly 60% of an equivalent SBR (per HydropureWater MBR spec).
What is a defensible CAPEX benchmark for a 200 m³/d electronics wastewater system?
Plan $250–$850 per m³/d installed for the full train; a 200 m³/d plant with precipitation, MBR, and RO will land near the upper half of that range. Membrane cassettes and the plate-and-frame filter press together absorb 60–70% of that capital cost.
How much will sludge disposal cost annually?
Metal hydroxide cake from a 200 m³/d plant, dewatered to 30–40% DS on a plate-and-frame press, typically runs $200–$500 per ton at a licensed hazardous-waste facility. That line is 15–25% of total OPEX and is the most commonly underestimated number in vendor quotes.