Ethiopia’s municipal sewage treatment plants still show large operational gaps: 89.1% of surveyed stages are functional, yet 86.4% report influent flow fluctuations that overload biology, and 64.5% run at or above design capacity, with 10.9% non-operational (Scientific Reports, 2025). For 2026 upgrades, MBR trains commonly reach about 95% COD removal under stable hydraulic load. UASBR trains typically deliver 78–92% COD removal and often need polishing to hold TSS below 50 mg/L. MBR CAPEX for a 5,000 m³/day plant is about ETB 800M versus about ETB 550M for UASBR—roughly 30% higher spend—so land, power reliability, and AAWSA compliance must be scored together.
Why Ethiopia’s Municipal Sewage Treatment Plants Struggle
Ethiopia’s surveyed WWTPs struggle because influent swings overload biology: 86.4% report flow fluctuations, 64.5% run at or above design capacity, and 10.9% are non-operational, while 89.1% of stages remain functional (Scientific Reports, 2025). Funding limits deepen the gap—70% of respondents cite finance as the main upgrade barrier.
Peak morning and evening flows in Addis Ababa routinely push reactors past the design hydraulic retention time. That diurnal pattern plus wet-season infiltration is why equalization belongs in Phase 1 rather than as a later add-on. Plants that skip the buffer keep losing COD removal every rainy season even after media or membrane spend.
Kotebe WWTP in Addis Ababa illustrates the pattern on the ground. The plant uses a UASBR configuration designed for 12,000 m³/day, yet rainy-season spikes of about 20% have driven roughly 30% COD bypass to the receiving water when biology cannot hold the surge. Most plants we size for Ethiopian cities therefore put equalization first, before any reactor swap. A stable feed recovers more compliance per birr than a larger bioreactor on a swinging inlet.
Addis Ababa’s wider network now includes about 36 AAWSA-managed plants. Combined design capacity is roughly 163,080 m³/day while actual discharge is about 112,039 m³/day (Haileselassie et al., 2025), so many assets sit under-loaded while a few older sites are overloaded. That mismatch inflates unit treatment cost on advanced trains and still leaves wet-weather bypass at constrained sites. Phased CAPEX—equalization and screening before biological rebuild—cuts hydraulic stress without forcing a full plant replacement in year one.
Underlying causes extend past the reactor wall. Deferred maintenance on screens, pumps, and sludge lines recreates the same overload after every rainy season, so strategic sequencing matters more than a single “ultimate” process diagram. Prioritizing equalization tanks as Phase 1 stabilizes influent flows, reduces hydraulic stress on biology, and creates a bankable foundation for later MBR or polishing modules.
2026 Engineering Specs for Ethiopia: Design Parameters by Technology
Meeting Ethiopia’s urban growth and AAWSA targets by 2026 needs design numbers tailored to altitude, influent variability, and available land. For MBR packages suited to Ethiopian municipal WWTPs, typical design uses HRT 6–12 hours, membrane flux 15–25 L/(m²·h) (LMH), and MLSS 8,000–12,000 mg/L on PVDF membranes at about 0.1 μm pore size. At Addis Ababa’s 2,355 m elevation, derate nominal flux by about 10%. Lower atmospheric pressure reduces oxygen transfer there, and operators who keep catalogue flux at altitude often foul membranes early in the first year.
UASBR systems stay energy-lean when designed at HRT 6–10 hours, upflow velocity 0.5–1.0 m/h, and COD loading 5–15 kg/(m³·day). UASBR alone often leaves TSS removal in the 65–80% band. Sand filters or dissolved air flotation (DAF) are therefore usually required if the plant must approach AAWSA’s <50 mg/L TSS target on a consistent wet-season basis. Residual COD was 125.1 mg/L, BOD₅ 61.7 mg/L, and TSS 85.8 mg/L in dry-season monitoring. Those values met inland discharge limits for that plant, yet they still sit above a strict 50 mg/L TSS municipal polish goal (Environmental Systems Research, 2024).
Waste stabilization pond (WSP) systems need land and time: pond depth 1.5–2.5 m, HRT 20–30 days, and BOD loading 20–50 kg/(ha·day). About 40% of Ethiopian WSPs report hydrogen sulfide (H₂S) odor issues near receptors. Covering anaerobic cells with HDPE liners and adding biofilters is the usual near-urban odor-control fix for those ponds. Across all three trains, equalization tanks sized for 20–30% of daily flow remain the shared hydraulic buffer. For a 10,000 m³/day plant that means a 2,000–3,000 m³ tank with mixers to stop solids settling and keep the feed homogeneous.
Design reviews should also lock pre-treatment aperture, grit removal, and wet-weather bypass logic before membrane or media orders are placed. Ethiopian municipal influent carries rags, grit, and FOG pulses that punish fine membranes and UASB inlet distributors alike. Plants that skip robust headworks pay for it later in diffuser replacements and blanket washout.
Headworks detail decides whether Phase 1 actually protects biology. Rotary screens should be paired with a bypass channel and a grit unit sized for rainy-season grit pulses, not only dry-weather averages. Ethiopian municipal sewers still admit construction debris and plastics; a single screen without duty/standby leaves the plant unprotected during washing. Operators should log differential head daily and set wash cycles against peak morning solids rather than against a fixed clock alone on Ethiopian municipal sewers.
For UASBR distributors, keep upflow velocity inside 0.5–1.0 m/h even when equalization is online. Short-circuiting from a clogged inlet pipe shows up as rising effluent COD before TSS moves. Weekly blanket-height checks plus a spare nozzle set are cheap insurance compared with reclaiming a washed-out granular sludge bed after a surge event. Where influent FOG is high, a DAF or grease trap ahead of the UASB pays back in fewer emergency desludges.
| Parameter | MBR Systems | UASBR Systems | WSP Systems |
|---|---|---|---|
| Hydraulic Retention Time (HRT) | 6–12 hrs | 6–10 hrs | 20–30 days |
| Membrane Flux (LMH) / Upflow Velocity (m/h) / Depth (m) | 15–25 LMH (reduce 10% for Addis Ababa) | 0.5–1.0 m/h | 1.5–2.5 m |
| MLSS (mg/L) / COD Loading (kg/m³/day) / BOD Loading (kg/ha/day) | 8,000–12,000 mg/L | 5–15 kg/m³/day | 20–50 kg/ha/day |
| Membrane Type / Post-Treatment for TSS / Odor Control | PVDF, 0.1 μm | Required (Sand filter/DAF for <50 mg/L TSS) | HDPE covers, Biofilters for H₂S |
| Equalization Tank Sizing (of daily flow) | 20–30% | 20–30% | 20–30% |
MBR vs UASBR vs WSP: Which Technology Fits Your Ethiopian WWTP?
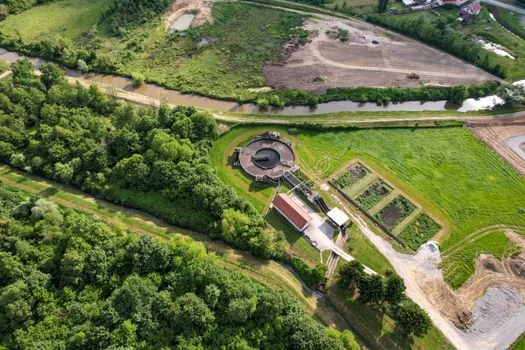
Technology selection for an Ethiopian municipal WWTP turns on influent strength, land, grid reliability, and AAWSA compliance certainty. MBR trains handle high-strength urban sewage with COD above 1,000 mg/L and TSS above 500 mg/L, while UASBR trains struggle when influent TSS exceeds 300 mg/L and usually need pre-settling to protect the sludge blanket. WSP trains prefer TSS below 200 mg/L; higher solids accelerate sludge accumulation and cut pond HRT effectiveness.
Land decides many Addis Ababa and secondary-city sites. MBR footprints run about 0.1–0.3 m² per m³/day treated, UASBR needs about 0.3–0.5 m²/m³, and WSP demands about 1.5–3.0 m²/m³ on typical municipal layouts. Where expansion land is only about 0.2 ha—as at constrained Kotebe parcels—MBR density is often the only path that keeps secondary treatment on site without relocating the works.
Power reliability flips the OPEX math. MBR energy use is typically 0.8–1.2 kWh/m³ for aeration and membrane scour. UASBR needs about 0.2–0.4 kWh/m³. WSP stays near 0.05–0.1 kWh/m³. In regional cities with outages longer than four hours per day, MBR plants need diesel backup sized for scour blowers. Without sized backup power, membranes can foul within a single shift during extended outages. MBR ran 6–12 times the unit cost of the other trains when utilization was low (Haileselassie et al., 2025).
On AAWSA targets of roughly <50 mg/L TSS and <100 mg/L COD, MBR is the most consistent without heavy tertiary units. UASBR with post-treatment can hit COD goals but still needs filtration or DAF for TSS. WSP without tertiary filtration and disinfection usually misses COD, TSS, and microbial limits. The decision rule we use on municipal bids in Ethiopia is deliberately simple. If influent TSS exceeds 300 mg/L and available land is under 0.5 ha, select MBR. If TSS stays below 200 mg/L and more than 2 ha are available, a WSP plus tertiary polish can be viable.
Sludge handling also differs by train and should appear in the OPEX model, not as an afterthought. MBR waste sludge is moderate in mass but often dilute. UASBR granular sludge is lower in mass and more stable. WSP sludge volumes are high and need drying beds or mechanical dewatering before haul. Ethiopian haul distances and tipping fees can erase the apparent CAPEX advantage of a cheap pond scheme.
| Feature | MBR Systems | UASBR Systems | WSP Systems |
|---|---|---|---|
| Influent COD Handling | High (>1,000 mg/L) | Medium (<1,000 mg/L) | Low (<500 mg/L) |
| Influent TSS Tolerance | High (>500 mg/L) | Limited (<300 mg/L, needs pre-settling) | Low (<200 mg/L) |
| Land Footprint (m²/m³ treated) | 0.1–0.3 (Very Compact) | 0.3–0.5 (Compact) | 1.5–3.0 (Extensive) |
| Energy Consumption (kWh/m³) | 0.8–1.2 (High) | 0.2–0.4 (Low) | 0.05–0.1 (Very Low) |
| AAWSA TSS Compliance (<50 mg/L) | Consistently Achieved | Requires Post-Treatment | Fails without Tertiary |
| AAWSA COD Compliance (<100 mg/L) | Consistently Achieved | Achieved with Post-Treatment | Fails without Tertiary |
| Sludge Production | Moderate (low solids content) | Low (granular, stable) | High (unstable, requires drying) |
CAPEX and OPEX Breakdown: 2026 Cost Models for Ethiopian WWTPs
Ownership cost for Ethiopian municipal plants splits into CAPEX and OPEX. Both lines are sensitive to forex on imported membranes and to plant utilization. For a new 5,000 m³/day works in Addis Ababa, MBR CAPEX typically sits at ETB 800M–1.2B. UASBR lands at ETB 550M–800M. WSP sits at ETB 300M–500M, reflecting simpler civil works for ponds. Under-utilized advanced trains inflate unit OPEX sharply—the same pattern seen when MBR assets run well below design flow.
OPEX spreads wider than CAPEX across the three trains. MBR often costs ETB 12–18/m³, with energy about 60% and membrane cleaning or replacement about 20%. UASBR runs about ETB 5–9/m³, where energy is about 40% and sludge disposal about 30%. WSP stays near ETB 3–6/m³, driven by land leasing (up to 50%) and labor (about 30%). Labor in Ethiopia is roughly 30% cheaper than in neighboring Kenya. Imported MBR membranes and controls can still run about 15% higher under tight forex, so spare-parts contingencies belong in year-one budgets.
Local cost adjustments decide whether a “cheap” process stays cheap after commissioning. Forex swings hit membrane cassettes, PLC hardware, and specialty blowers first. Civil works and local labor move more slowly than imported mechanical packages in most Ethiopian municipal tenders. Teams that procure long-lead imports against a fixed ETB envelope without a contingency line usually cut screening or equalization later—and recreate the hydraulic failures this guide starts from.
Financing still centers on blended public money for AAWSA-compliant works. The World Bank Urban Water Supply and Sanitation Project (UWSSP) has historically covered up to about 60% of CAPEX for eligible municipal plants. Private operators and PPP vehicles can also tap local 10-year loans near 8% from institutions such as the Commercial Bank of Ethiopia when tariff and escrow structures are clear. Phased packages that start at ETB 50M–100M for headworks are often easier to close than a single ETB 1B MBR EPC.
When comparing OPEX bids, force vendors to state energy at the design average flow and at 50% utilization. Ethiopian connection rates still lag water supply in many districts, so a 5,000 m³/day nameplate may treat closer to 2,500–3,500 m³/day for years. That under-load is exactly where MBR unit costs spike toward the upper end of the USD 0.045–0.546/m³ field range reported for AAWSA plants in 2022. A UASBR-plus-polish train can look “worse” on paper at full load and still win on real cash flow at half load.
Spare-parts lead times also belong in the risk register. PVDF cassettes, specialty blowers, and ClO₂ generator cells often clear customs slower than civil progress. Hold a minimum on-site stock for seals, diffusers, and critical probes, and write delivery liquidated damages against the long-lead list—not only against concrete milestones. Projects that treat imports as an afterthought usually commission with temporary bypasses that become permanent.
| Cost Category | MBR Systems (5,000 m³/day) | UASBR Systems (5,000 m³/day) | WSP Systems (5,000 m³/day) |
|---|---|---|---|
| CAPEX (ETB) | 800M–1.2B | 550M–800M | 300M–500M |
| OPEX (ETB/m³) | 12–18 | 5–9 | 3–6 |
| OPEX Breakdown: Energy | 60% | 40% | ~10% |
| OPEX Breakdown: Membrane Replacement | 20% | N/A | N/A |
| OPEX Breakdown: Sludge Disposal | ~10% | 30% | ~20% |
| OPEX Breakdown: Land Leasing/Labor | ~10% | ~30% | 50% (land) / 30% (labor) |
Phased Upgrade Blueprint for Ethiopian WWTPs

Phased upgrades cut downtime and cash-flow exposure on existing Ethiopian municipal plants. The practical order is to fix hydraulics first, then upgrade biology, then add automation once the feed is stable. The sequence below matches failure modes reported across Addis Ababa surveys and keeps each phase bankable on its own without waiting for a full-plant refinance.
- Phase 1 (0–6 months): Stabilize influent and pre-treatment. Add equalization for 20–30% of daily flow and install efficient rotary screens to remove rags and plastics from Ethiopian WWTP influent (for example GX Series). Phase cost is typically ETB 50M–100M. It can cut hydraulic stress by up to about 40% before any reactor work starts.
- Phase 2 (6–18 months): Upgrade biological treatment. On UASBR plants, add MBR modules in parallel (for example DF Series) to lift COD and TSS without demolishing the anaerobic tanks. On WSP sites, convert selected cells to aerated lagoons to shorten HRT. Expect about ETB 200M–400M. Overall COD removal can exceed 90% when feed is already equalized.
- Phase 3 (18–24 months): Automate and disinfect. Install PLC chemical dosing for pH and coagulants, plus chlorine dioxide generators for Ethiopian WWTP disinfection to control pathogens such as Vibrio cholerae. Phase cost is about ETB 100M–150M. Optimized chemical use can trim OPEX by up to about 25%. The same staged logic appears in Abuja’s WWTP upgrade blueprint for Vibrio cholera risks.
Dire WWTP combined UASBR and WSP trains before its 2025 modular upgrade. Within 12 months of integrating MBR modules, COD removal rose from 72% to 94%. TSS fell from 120 mg/L to 30 mg/L, meeting the AAWSA TSS band ahead of the original schedule. Modular biology after hydraulic stabilization is the pattern that repeatedly works on Ethiopian municipal sites when cash flow and outage risk are both constrained.
Selection Checklist, Cost Drivers, and Next Step
Who this is for: municipal engineers, EPC process leads, and procurement teams sizing or upgrading plants for Addis Ababa and secondary Ethiopian cities under AAWSA discharge rules. Who should look elsewhere: industrial park ETPs with heavy metals or dye houses need dedicated industrial trains, not a municipal MBR or UASBR copy-paste. Main cost drivers to lock in the bid package include equalization volume, membrane or media imports, backup power hours, sludge haul distance, and forex contingency on spare parts.
Selection checklist before you freeze the process train:
- Measure dry- and wet-season peak-to-average flow ratios for at least 30 days.
- Confirm influent COD and TSS against the 1,000 / 500 / 300 / 200 mg/L decision bands above.
- Map usable land in m² per m³/day and grid outage hours per day.
- Budget post-treatment if the base train is UASBR or WSP and TSS must stay <50 mg/L.
- Derate MBR flux about 10% for Addis Ababa altitude (2,355 m).
- Separate Phase 1 CAPEX (ETB 50M–100M) so financing can close before biology rebuild.
- Include membrane CIP chemicals and a 5–8 year membrane replacement reserve in OPEX.
Need a duty-sized MBR, screen, or disinfection package for Ethiopian municipal flows? Share influent and land constraints via our request a municipal WWTP quote form. We return a phased equipment list tied to peak flow and AAWSA targets.
Frequently Asked Questions
What are AAWSA’s 2026 effluent standards for municipal WWTPs in Ethiopia?
AAWSA municipal planning targets commonly cited are BOD₅ <30 mg/L, COD <100 mg/L, and TSS <50 mg/L, plus pathogen reduction suited to the receiving water. Design teams should confirm the permit text for each discharge point before freezing tertiary scope. Inland national limits applied at Kality allowed higher residual COD and TSS than the strict municipal polish band, so tertiary steps are still required when wet-season TSS must stay near 50 mg/L.
How do I size an equalization tank for a 10,000 m³/day plant in Addis Ababa?
Size equalization at 20–30% of daily flow for Addis Ababa diurnal and wet-season swings. For 10,000 m³/day that is about 2,000–3,000 m³ of working volume, with mixers to keep solids suspended. Most plants we size for Ethiopian cities land near the upper third of that band when rainy-season peaks exceed 20% of design flow.
What is the lifespan of MBR membranes under Ethiopian altitude and variable influent?
MBR membranes in Ethiopian municipal service typically last 5–8 years when screening, grit removal, and chemical cleaning stay on schedule. Addis Ababa’s 2,355 m elevation and large influent swings shorten life if flux is not derated about 10%. Scour-air failures during outages also cut life. Stable equalization matters as much as CIP chemistry.
Can UASBR plants in Ethiopia meet AAWSA’s <50 mg/L TSS standard without post-treatment?
No. UASBR TSS removal usually sits between 65–80%, so effluent TSS often remains above 50 mg/L without tertiary treatment. Kality’s UASB–trickling filter monitoring still showed average TSS about 85.8 mg/L while meeting inland discharge limits. Sand filters, DAF, or polishing ponds are required when the municipal TSS target is tighter.
What financing options support municipal WWTP upgrades in Ethiopia?
Typical stacks combine municipal budget lines, World Bank UWSSP-style support covering up to about 60% of compliant CAPEX, and commercial 10-year debt near 8% from local banks. PPP structures add private capital when tariffs and performance guarantees are bankable. Phase 1 equalization packages at ETB 50M–100M are often easier to close first than a full MBR rebuild.
Further Reading
Explore these in-depth articles on related wastewater treatment topics: