A high-strength organic wastewater reverse osmosis system treats COD above 2,000 mg/L using fouling-resistant membranes at 20–35 LMH and 70–85% recovery. Packages for 10–200 m³/h span roughly ¥1.2M–¥8M with pretreatment and controls included.
Why a High-Strength Organic Wastewater Reverse Osmosis System Fails with Conventional Membranes
High-strength organic RO treats wastewater with COD above 2,000 mg/L using fouling-resistant membranes at 20–35 LMH and 70–85% recovery. Medium-pressure trains use 0.8–1.2 kWh/m³; high-pressure trains reach 1.2–1.5 kWh/m³ at 50–80 bar. CAPEX for 10–200 m³/h industrial packages runs about ¥1.2M–¥8M when pretreatment and controls are included.
Organic fouling in reverse osmosis (RO) systems treating high-strength wastewater (COD > 2,000 mg/L) cuts permeate flux by 50–70% within 30 days when membrane chemistry is mismatched. Proteins, polysaccharides, and humic acids adsorb onto hydrophobic polyamide thin-film composite (TFC) surfaces and form a dense gel layer. Differential pressure rises, and Clean-in-Place (CIP) cycles become more aggressive. Per EPA 2023 benchmarks, those frequent cleanings accelerate polymer degradation and often cut the expected three-year membrane life to less than 12 months in high-load service.
A semiconductor plant in Bac Ninh, Vietnam, shows the same failure mode in the field. Effluent carried non-biodegradable solvents such as isopropyl alcohol (IPA) and tetramethylammonium hydroxide (TMAH) with copper and nickel. RO membrane life fell from a projected 36 months to 18 months. Residual solvents interacted with the aromatic polyamide layer and drove deep-pore fouling that standard CIP could not clear. Organic fouling typically raises annual OPEX by 20–40%, with chemical cleaning at ¥50,000–¥150,000 per year and membrane replacement that can exceed ¥1M per year on a 100 m³/h train.
Conventional RO packages are generally sized for cleaner feeds where COD stays below 500 mg/L. At COD > 3,000 mg/L, osmotic pressure and concentrate fouling potential exceed the limits of standard TFC membranes. Plants then need hydrophilic architectures—zwitterionic polymeric membranes or ceramic options—to limit organic adhesion. Without that material shift, high-strength service becomes a cycle of short membrane life and rising maintenance cost. Teams comparing broader industrial wastewater treatment flowsheets should treat RO as a polishing step, not the first solids barrier.
2026 Specs for High-Strength Organic Reverse Osmosis Systems
Modern RO trains built for 2026 duty should hold membrane flux of 20–35 LMH on fouling-resistant zwitterionic membranes, above the 15–25 LMH ceiling common for conventional polyamide membranes in high-COD service. Field trials from 2024–2025 operated these membranes at 20–40 bar. Recovery is the hard constraint: low-strength streams may reach 95% recovery, while COD 2,000–10,000 mg/L streams are usually capped at 70–85% to keep organics below spontaneous precipitation and irreversible fouling. For scale, routine brackish-water RO operates at 2–17 bar with 80–85% recovery (Wikipedia, Reverse osmosis), so high-organic duty sits well above standard water-treatment practice.
Energy use still drives EHS and finance reviews. Medium-pressure systems (20–40 bar) are expected to consume 0.8–1.2 kWh/m³. High-pressure systems (50–80 bar) for very concentrated effluent typically land at 1.2–1.5 kWh/m³. Those ranges assume high-efficiency pumps and energy recovery devices (ERDs), which are standard on the Industrial Reverse Osmosis (RO) Water Treatment System packages HydropureWater supplies for fouling-prone organic feeds.
| Parameter | Conventional RO (Polyamide) | Fouling-Resistant RO (Zwitterionic) | Ceramic RO (Alumina/Zirconia) |
|---|---|---|---|
| Design Flux (LMH) | 12–18 | 20–35 | 40–60 |
| Recovery Ratio (%) | 50–65% | 70–85% | 80–90% |
| Energy (kWh/m³) | 1.0–1.4 | 0.8–1.2 | 1.5–2.2 |
| Max Influent COD (mg/L) | < 2,000 | 2,000–8,000 | > 10,000 |
| Permeate COD (mg/L) | < 50 | < 30 | < 20 |
Discharge rules such as EPA 40 CFR Part 433 for metal finishing make pretreatment non-negotiable. EPA promulgated that guideline in a final rule on July 15, 1983 (48 FR 32485), and it still covers about 44,000 facilities that discharge directly or through POTWs (US EPA). An EPA rulemaking now under way targets PFAS discharges from a subset of metal finishing and electroplating facilities, so permit conditions for finishing sites can tighten further. When TSS exceeds 100 mg/L, DAF pretreatment systems to reduce RO membrane fouling by 40–60% are required. For high-TOC streams (>500 mg/L), integrating MBR systems for high-COD wastewater pretreatment before RO keeps RO feed inside a safe envelope. Most plants we size for these duties target permeate metals below 0.1 mg/L and TOC below 20 mg/L after the full train.
Fouling-Resistant vs. Conventional RO Membranes: Performance Comparison
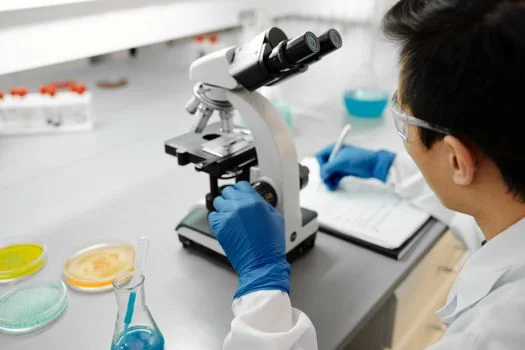
Zwitterionic thin-film composite membranes keep about 90% of initial flux after 90 days on high-COD feed (5,000 mg/L). Conventional polyamide membranes typically lose about 50% flux under the same duty. The gap is surface energy: zwitterionic coatings hold a hydration layer that blocks direct organic contact with the polymer. Hydrophobic polyamide surfaces invite cake buildup that high-pH cleaners struggle to remove.
Ceramic membranes sit at the high end for extreme feeds. Alumina or zirconia elements resist organic fouling and tolerate aggressive solvents or temperatures that destroy polymeric membranes. The trade-off is cost and pressure. Ceramic trains often run at 50–80 bar and carry CAPEX 3–5× polymeric systems, with membrane costs of ¥2,000–¥5,000/m² versus ¥500–¥1,500/m² for polymeric TFCs. Engineers weighing ceramic membrane water options against polymeric RO usually reserve ceramics for COD above about 8,000 mg/L. For most pharmaceutical and semiconductor plants, zwitterionic membranes still give the better performance-to-cost balance.
| Metric | Conventional Polyamide | Zwitterionic TFC | Ceramic Membranes |
|---|---|---|---|
| Cleaning Frequency | 4–6 times/month | 1–2 times/month | As needed (high resistance) |
| Membrane Lifespan | 12–18 months | 36–48 months | 10+ years |
| Resistance to Organics | Low (Hydrophobic) | High (Hydrophilic) | Ultra-High |
| OPEX Impact | Baseline | 25–40% Reduction | 10–15% Reduction (high energy) |
| System CAPEX | ¥1.2M–¥6M | ¥1.5M–¥8M | ¥5M–¥25M |
Hidden OPEX often flips the CAPEX ranking. A fouling-resistant package may cost 20–30% more up front, yet lower chemical use, CIP labor, and replacement frequency usually cut total cost of ownership inside 24 months. High-salinity co-contaminants add mineral scaling risk on top of organic fouling, so RO design must balance both mechanisms, as covered in the guide on RO specs for high-salinity streams (complementary to organic wastewater).
Industrial RO Pretreatment with DAF and MBR for High COD Feed
Industrial RO pretreatment for high-COD feed starts with a physical barrier, because spiral-wound elements allow one-way flow only (Wikipedia, Reverse osmosis). The design does not allow backpulsing or air scour, so deposited solids must be stopped upstream. Dissolved air flotation (DAF) can remove 90–95% of TSS and 60–80% of fats, oils, and grease (FOG), cutting the organic fouling load on downstream RO by up to 60%. Pretreatment remains the cheapest way to protect high-value membrane area. Where organics are mostly particulate or emulsified, a DAF pretreatment system acts as a sacrificial barrier so only soluble COD reaches the RO. Food plants and oily wastewater lines need that barrier; FOG coats RO surfaces within hours if it is not removed first.
Soluble high-COD streams need biological polishing before membranes. Membrane bioreactors typically deliver 95% COD removal and 99% TSS removal, often leaving RO feed COD below 500 mg/L. Converting biodegradable organics to biomass first lets MBR systems for high-COD wastewater pretreatment support higher RO flux at lower pressure. A pharmaceutical plant in Germany added an MBR stage ahead of RO and stretched membrane replacement from every 6 months to every 24 months at influent COD of 8,000 mg/L. That layout is the practical model for an mbr followed by reverse osmosis plant on strong organic effluent.
Chemical conditioning still controls biofouling and scale. Phosphonate antiscalants limit mineral deposition, while biocides hold biofilm on high-organic feeds. A chlorine dioxide generator is common because ClO₂ works as a biocide with fewer chlorinated byproducts than free chlorine, at dosing costs near ¥0.1–¥0.3/m³. Pair chemical control with solid physical pretreatment so RO stays a polishing step. That split is what keeps long-term differential pressure stable.
What RO Systems Suit Semiconductor Production?
Reverse osmosis systems for semiconductor production must handle solvent-bearing, metal-laden rinse waters without rapid organic fouling or ionic breakthrough. IPA and TMAH reject poorly compared with salts, so many fabs specify double-pass RO or solvent-tolerant membranes when TOC limits sit near 20 mg/L. Membrane references confirm the weak spot; in dealcoholization duty, water and ethanol pass through the membrane more readily than most non-volatile components (Wikipedia, Reverse osmosis). Most plants we size for fab wastewater keep zwitterionic RO behind DAF or MBR, hold recovery at 70–85% on COD 2,000–8,000 mg/L, and budget membrane life of 36–48 months only when pretreatment is stable.
Semiconductor fab wastewater and RO membrane lifespan
The Bac Ninh case above — 36 months projected, 18 months delivered — is the baseline outcome when solvent control upstream is skipped. Copper and nickel limits under metal-finishing rules push permeate metals below 0.1 mg/L in many permits. That target is reachable when RO feed TSS stays low and CIP responds to a 10–15% normalized flux drop. Facilities aligning with tighter EU reuse or discharge programs can cross-check the compliance timeline in the EU Urban Wastewater Treatment Directive: Compliance, Deadlines & Tech briefing before freezing membrane chemistry.
2026 Cost Benchmarks: CAPEX, OPEX, and ROI for Industrial RO Systems
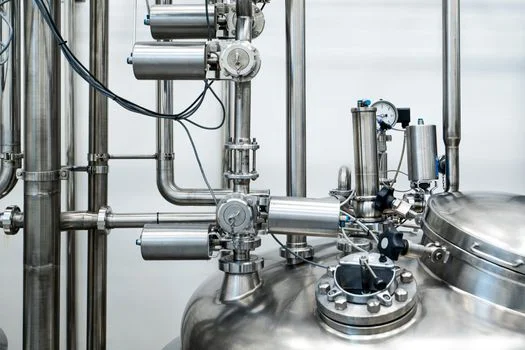
CAPEX for industrial RO treating high-strength organic wastewater in 2026 spans about ¥1.2M for small 10 m³/h units to ¥8M for 200 m³/h trains with automated pretreatment and controls. Those figures already assume fouling-resistant membranes and energy recovery. Zero liquid discharge and reuse mandates keep procurement teams comparing these packages against rising freshwater prices and discharge penalties.
OPEX is dominated by power and membrane upkeep. On a typical 100 m³/h system, energy is about 50% of unit cost (¥0.4–¥0.8/m³), membrane replacement about 30% (¥0.3–¥0.5/m³), and chemicals plus labor about 20% (¥0.2–¥0.3/m³). Fouling-resistant RO usually reaches ROI in 3–5 years, versus 5–7 years for conventional membranes, because OPEX falls 25–40% with fewer CIP cycles and longer element life.
| System Capacity (m³/h) | Estimated CAPEX (¥ Millions) | Daily OPEX (¥/m³) | Annual Maintenance (¥) |
|---|---|---|---|
| 10 m³/h | 1.2 – 1.8 | 1.2 – 1.6 | 80,000 – 120,000 |
| 50 m³/h | 2.5 – 3.5 | 1.0 – 1.4 | 250,000 – 400,000 |
| 100 m³/h | 4.0 – 5.5 | 0.8 – 1.2 | 450,000 – 700,000 |
| 200 m³/h | 6.5 – 8.0 | 0.7 – 1.1 | 800,000 – 1,200,000 |
Reuse often closes the business case. In many industrial hubs, returning RO permeate to cooling towers or process water cuts freshwater intake by ¥1.5–¥3/m³ on 2024 industry averages. Plants in water-stressed regions, including those covered in the analysis of regional compliance requirements for industrial wastewater treatment, can recycle about 80% of process water when recovery and pretreatment stay inside design limits. Regional cost and compliance checklists such as the Industrial Wastewater Treatment in Christchurch: 2026 Engineering Guid help procurement compare local discharge fees against reuse savings.
Which Industrial Reverse Osmosis Systems Are Recommended?
Recommended industrial reverse osmosis systems for high-organic loads start with feed characterization for COD, TOC, TSS, and specific solvents, then match membrane chemistry to the fouling index. Lab and pilot work typically costs ¥5,000–¥20,000 and prevents oversizing flux. As a working rule, COD < 3,000 mg/L can use enhanced polyamide; 3,000–8,000 mg/L needs zwitterionic TFC; above 8,000 mg/L usually needs ceramic or hybrid hardware.
After membrane selection, size from recovery and design flux. A plant needing 100 m³/h permeate at 80% recovery must supply 125 m³/h of feed. At 25 LMH on fouling-resistant membranes, that duty needs about 4,000 m² of membrane area. Aggressive flux assumptions remain the most common cause of early industrial RO failure.
Vendor checks should go past the first quote. Prefer a 3-to-5-year membrane warranty and demonstrated energy use below 1.2 kWh/m³ on comparable organic feeds. Local service matters because a high strength organic wastewater reverse osmosis system needs periodic audits of antiscalant dose and CIP setpoints. Rank options on five-year TCO, not CAPEX alone, and confirm the package can meet current permits plus 2026–2027 discharge updates.
Selection Checklist, Fit, and Next Step
Use this short checklist before freezing a bid package:
- Measure COD, TOC, TSS, FOG, and named solvents on representative shifts.
- Set recovery at 70–85% for COD 2,000–10,000 mg/L unless pilot data supports higher.
- Require DAF when TSS > 100 mg/L or FOG is present; require MBR when soluble COD stays high.
- Select zwitterionic TFC for COD 3,000–8,000 mg/L; evaluate ceramic only for extreme loads.
- Budget energy at 0.8–1.5 kWh/m³ and verify ERD inclusion on medium- and high-pressure trains.
- Compare five-year TCO, including CIP chemicals and membrane replacement, not CAPEX alone.
- Demand a membrane warranty of 3–5 years and documented CIP triggers (10–15% flux drop).
Who this is for: process engineers, EPC designers, and procurement managers sizing RO for food, pharma, semiconductor, or metal-finishing wastewater with COD above 2,000 mg/L. Who should look elsewhere: sites with only low-COD utility water, or plants that still need primary clarification and have not defined a pretreatment path. To size a fouling-resistant train against your COD profile and reuse target, send the influent sheet through our request-quote form for high-strength organic RO.
Frequently Asked Questions
What is the maximum COD limit for RO treatment?
Standard RO systems handle COD up to 2,000 mg/L. Specialized fouling-resistant RO membranes can process influent COD up to 10,000 mg/L when recovery stays near 70% to limit concentrate precipitation. Streams above 3,000 mg/L COD still need MBR or DAF pretreatment to protect membrane integrity. Permeate COD targets of <30 mg/L on zwitterionic trains, or <20 mg/L on ceramic trains, remain realistic only when feed solids and FOG are controlled upstream (HydropureWater field data, 2025).
How often should RO membranes be cleaned in high-organic service?
Conventional membranes may need cleaning every 5–7 days on high-strength organic feeds. Fouling-resistant zwitterionic membranes typically extend that interval to 15–30 days, or about 1–2 CIP events per month in stable service. Trigger CIP on a 10–15% drop in normalized flux or a 15% rise in differential pressure. Keeping that schedule is the most reliable way to avoid irreversible organic gel layers that aggressive high-pH cleans cannot fully restore.
Can RO remove organic solvents like IPA or ethanol?
RO removes larger organic molecules well, but small polar solvents such as IPA or ethanol usually show only 60–80% rejection versus 99%+ for salts. Semiconductor and pharma plants that must hold TOC below 20 mg/L often need double-pass RO or solvent-resistant membranes. Pretreatment that cuts bulk COD still helps, because lower organic mass at the membrane surface slows gel-layer growth even when solvent rejection remains incomplete on a single pass.
What is the typical RO membrane lifespan in a pharmaceutical plant?
In pharmaceutical service with high organic loads, a conventional polyamide membrane often lasts 12–18 months. Fouling-resistant zwitterionic membranes behind robust MBR pretreatment commonly reach 36–48 months. The controlling factor is pretreatment quality: removing most organic carbon before RO matters more than brand claims on the element itself. Plants that skip biological or DAF polishing rarely see the upper end of that life range.
What energy use should buyers expect for high-strength organic RO?
Medium-pressure fouling-resistant trains at 20–40 bar typically consume 0.8–1.2 kWh/m³ when pumps and ERDs are specified correctly. High-pressure service at 50–80 bar for very concentrated effluent usually lands at 1.2–1.5 kWh/m³. Ceramic systems can run higher, about 1.5–2.2 kWh/m³, because of their pressure band. Energy is often half of OPEX on a 100 m³/h unit, so ERD selection belongs in the first design review, not a later value-engineering cut.